Financial crisis

Bleak Anniversaries on Wall Street

6604564453_f75e4862f7_z.jpg

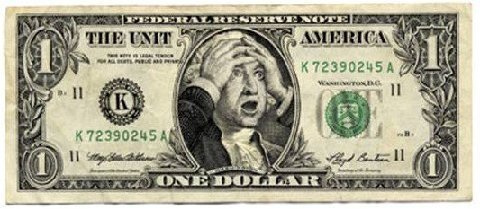
Past events, no matter how horrible, can be instructive reminders about where we are today. This week marks the fifteenth anniversary of the 9-11 attacks, which helps me think about the people I knew who perished that frightful day. The anniversary also serves as a gut check about something we know, but don’t like to dwell on: bad things can happen at any time, so we better enjoy what we have today or at least try to make a plan to change what we don’t like. We are also approaching the eighth anniversary of the financial crisis, which brought the U.S. financial system to its knees. From September 15 - 21 2008, four investment banks were gone (Lehman Brothers went broke, Merrill Lynch was purchased at a fire sale by Bank of America and Morgan Stanley and Goldman Sachs were forced to become bank holding companies); global insurance giant AIG was bailed out; the money market fund industry was rocked after the net asset value of shares in the Reserve Primary Money Fund fell below $1 per share; and the Treasury Department introduced the first version of TARP, which granted authority to purchase $700 billion of mortgage-related assets for two years.

Thankfully, those dark days are behind us, but for those still worried about the financial system, Moody’s Analytics notes, “Since the financial crisis, the banks have raised substantial amounts of capital, significantly improved their liquidity, and vastly upgraded their risk management practices…It is also reassuring that regulators appear to be carefully monitoring the financial system, and willing and able to take action to head off problems before they become existential economic threats.”

Both during and after the crisis, the Federal Reserve played an active role in helping to stabilize the financial system. In addition to slashing interest rates, it embarked on three versions of bond buying, which were intended to stimulate economic growth. Some believe that the Fed’s action helped save the U.S. economy, but eight years hence, the reversal of those strategies are causing consternation. Friday’s stock market rout was an excellent case in point.

The cause of the selloff, according to the financial media, was a statement by Boston Fed President Eric Rosengren, who said “a reasonable case can be made” for tightening interest rates to avoid overheating the economy. Additionally, a previously unannounced speech by Fed Governor Lael Brainard on Monday (a day ahead of the Fed’s blackout period on giving public comment before its upcoming meeting) got the rumor mill swirling.

Are these two previously dovish Fed officials getting out in front of the public to signal a potential rate hike at the Fed’s policy Sep 20-21 policy meeting? Never mind that recent manufacturing data has been terrible, job growth slowed in August and core retail sales were weak in July. The likelier scenario for the Friday selloff is a more reasonable one articulated by a hedge fund manager I know: “Both stocks and bonds are relatively expensive right now…any suggestion that two dovish Fed officials’ spurring the selloff seems more like a bug looking for a windshield.”

Federal Governor Daniel Tarullo seems to agree. He told CNBC on Friday he wants to see more evidence of sustained inflation before considering an interest rate increase and currently, “We're not running a hot economy.” However, Tarullo also acknowledged “There's no question...when rates are low for a long time that there are opportunities for frothiness and perhaps over-leverage in particular asset markets.”

In other words, when rates stay so low for so long, investors look past fundamentals, drive prices higher and can become complacent. One sign of that complacency can be seen in the VIX index, which is a measure of the expected swings in the S&P 500 over the next thirty days. Recently, the 30 day annualized volatility (of daily changes) in the S&P 500 fell to its lowest level since 1994.

Friday’s selling may simply be an proof that people periodically remember that the risks they previously accepted, may no longer feel so great, especially considering the age of the bull market. But as the analysts at Capital Economics note, “The fact that volatility was low in the mid-1990s did not preclude equity prices from rising for several years as a bubble inflated.”

MARKETS: Stocks tumbled 2.5 percent on Friday, pushing indexes down on the week.

  • DJIA: 18,085, down 2.2% on week, up 3.8% YTD
  • S&P 500: 2127, down 2.4% on week, up 4.1% YTD
  • NASDAQ: 5125, down 2.4% on week, up 2.4% YTD
  • Russell 2000: 1219, down 1.5% on week, up 7.3% YTD
  • 10-Year Treasury yield: 1.68% (from 1.63% week ago), highest level since June 23, the day of the Brexit vote
  • British Pound/USD: 1.3262
  • October Crude: $45.88
  • December Gold:  at $1,334.50
  • AAA Nat'l avg. for gallon of reg. gas: $2.18 (from $2.21 wk ago, $2.37 a year ago)

THE WEEK AHEAD:

Mon 9/12:

Tues 9/13:

6:00 NFIB Small Business Optimism Index

Weds 9/14:

8:30 Import and Export Prices

Thursday 9/15:

8:30 PPI

8:30 Retail Sales

8:30 Empire State Mfg Survey

8:30 Philadelphia Fed Business Outlook

9:15 Industrial Production

10:00 Business Inventories

Friday 9/16:

8:30 CPI

10:00 Consumer Sentiment

Stocks Recover: Is Brexit Fallout Over?

27259819464_8b35e27730_z.jpg

Global stocks have mostly recovered from the previous week's steep sell-off, so is the Brexit fallout over? History may or may not look back on June 23, 2016 and declare it “UK Independence Day”. Since residents in the United Kingdom voted in a non-binding referendum to leave the European Union, there is still so much unknown, including who will succeed Prime Minister David Cameron. Despite an internal Tory party horse race, the leading contenders are Theresa May, who half-heartedly supported the Remain camp and Michael Gove, who along with former London mayor Boris Johnson, was a leader of the Leave campaign. (Here’s an easy way to remember their names: Invoke the Clash and hum to yourself, “Should I May or Should I Gove?”) As the next Prime Minister grapples with how to leave EU, US consumers and investors are trying to understand the impact of the historic vote. Unlike the run of the mill correction that we saw earlier this year, the UK’s exit from the 28-member union is an “exogenous event.” That means that it came from outside the predicted modeling system that most economists utilize and as a result, can have significant, negative effects on prices.

We saw how negative on the first two days of trading following the vote: the British pound sterling tumbled to its lowest level against the US dollar in more than three decades and global stocks fell sharply. Meanwhile, bastions of safety like US treasuries, German bunds and gold saw big inflows. Despite the magnitude of the surprise, large financial firms said that even in the hours after the vote, there was no liquidity crisis and markets functioned well. And by the end of the first full week after the vote, the damage was fairly contained and most global markets recouped their initial losses.

So is the Brexit fallout over? It would be great to think so, but that might be a case where optimism clouds a realistic assessment of the situation. Consider this: nine years ago, another unexpected June event occurred: investment banking firm Bear Sterns (BS) had to bail out two of its hedge funds that were collapsing because of bad bets on subprime mortgages. At the time, there was no mystery surrounding the risks that were emerging, though 15 months later, the world seemed shocked to discover what seemed clear in the middle of 2007: something very bad was brewing.

In June 2007, the New York Times said the Bear Sterns hedge fund debacle stemmed “directly from the slumping housing market and the fallout from loose lending practices that showered money on people with weak, or subprime, credit, leaving many of them struggling to stay in their homes. Bear Sterns averted a meltdown this time, but if delinquencies and defaults on subprime loans surge, Wall Street firms, hedge funds and pension funds could be left holding billions of dollars in bonds and securities backed by loans that are quickly losing their value.”

While at the time, the event did seem small and well contained; here is the timeline of what occurred next:

  • June 2007: BS Bails out hedge funds; markets convinced that all is well
  • October 2007: US stock indexes hit all-time highs
  • March 2008: BS goes broke and is taken over by JP Morgan Chase
  • September 2008: Lehman Brothers Holdings files for Chapter 11 bankruptcy protection; Bank of America purchases Merrill Lynch; the Federal Reserve Bank of New York is authorized to lend up to $85 billion to AIG; the Reserve Primary Money Fund falls below $1 per share; Goldman Sachs and Morgan Stanley become bank holding companies

This is not to suggest that Brexit will cause a financial crisis, but we should carefully consider what dangerous spillover effects could occur. While US banks are better capitalized than they were leading up to the fall of 2008, the UK and European banks do not look nearly as healthy. In the two trading sessions after Brexit, the European Bank index lost about a quarter of its value and UK based banks did even worse.

And if European growth slows, its weaker economies (Greece, Italy, Spain) will once again be at the heart of sovereign debt questions. Additionally, as the dollar rises, emerging markets like China could come under pressure, echoing what happened in the first six weeks of the year, when global stocks tumbled and US stock corrected.

In terms of the US economy, analysts at Capital Economics say the UK and the EU account for 4 and 15 percent of US exports, respectively. If both regions go into a recession, Brexit could shave 0.2-0.3 percent from the current annual US growth rate of about 2 percent.

But estimates can be rocked by emotions. A US-based multinational may hold back on hiring everywhere to see how things shake out post-Brexit. For US exporters, the rising US dollar will create a drag on competitiveness in overseas markets and could potentially trigger lay offs at home. And if non-affected businesses and consumers start to feel unnerved, they too might pull in the reins, causing the US economy to slow down more than anticipated.

This week’s June employment report may go a long way to soothe nervous economists and investors. The May report was a dud-only 38,000 jobs were added, the worst month since September 2010. This year, the economy has added 149,600 jobs per month on average, the worst start to a year since 2009. Economists are hopeful that the job picture improved in June. The consensus is that 180,000 jobs were added during the month, including the return of 35,000 striking Verizon workers, and that the unemployment rate will edge up from 4.7 percent, the lowest since November 2007, to 4.8 percent.. Stronger than expected summer job creation may force the Fed to at least consider a hike at the September meeting (July is likely off the table due to Brexit), though the market is still betting on December as the only quarter-point increase for 2016.

MARKETS: Brexit uncertainty may test the third longest bull market in history, but in the first full week of trading, investors took the news in stride. Bond yields hit all-time lows around the world last week. The yield on the 10-year U.S. Treasury note touched a record low of 1.385%, breaking its previous intraday low of 1.389% set on July 24, 2012, when it also set a record closing low of 1.404%.

  • DJIA: 17,949, up 3.1% on week, up 3% YTD
  • S&P 500: 2102, up 3.2% on week, up 2.9% YTD
  • NASDAQ: 4862, up 3.3% on week, down 2.9% YTD
  • Russell 2000: 1156, up 2.6% on week, up 1.8% YTD
  • 10-Year Treasury yield: 1.446% (from 1.56% a week ago)
  • British Pound/USD: $1.3277, down 2.3% on the week, down 13.2% since Brexit vote (touched $1.3118 on Monday, its lowest level in 31 years)
  • August Crude: $48.99, up 1.4% on week
  • August Gold:  at $1,339, up 1.3% on week, highest settlement since July, 2014
  • AAA Nat'l avg. for gallon of reg. gas: $2.28 (from $2.31 wk ago, $2.77 a year ago)

THE WEEK AHEAD:

Mon 7/4: INDEPENDENCE DAY-US MARKETS CLOSED

Tues 7/5:

U.K. Conservative Party lawmakers begin balloting to elect a successor to David Cameron as prime minister

10:00 Factory Orders

Weds 7/6:

8:30 International Trade

10:00 ISM Non-Mfg Index

2:00 FOMC Minutes

Thursday 7/7:

U.K. Conservative Party leadership holds second vote

8:15 ADP Private Sector Job Report

Friday 7/8:

8:30 June Employment Report

3:00 Consumer Credit

Saturday 7/9:

Group of 20 trade ministers meeting in Shanghai

What Does Brexit Mean for MY Money?

27279158203_4c8311e4b8_z.jpg

Since voters in the United Kingdom decided to leave the European Union last week, US consumers, investors and even travelers are trying to understand the impact of the historic Brexit vote. The question I continue to field is" “What does Brexit mean for MY money?”  Unlike the run of the mill correction that we saw earlier this year, the UK’s exit from the 28-member union is an “exogenous event.” That means that it has come from outside the predicted modeling system that most economists utilize and as a result, can have significant, negative effects on prices. For example, the British pound sterling tumbled to its lowest level against the US dollar in thirty years and global stocks have fallen sharply. Meanwhile, bastions of safety like US treasuries, German bunds and gold are rising. Still, large financial firms are saying that so far, there is no liquidity crisis and markets are functioning well.

While that is indeed good news, let’s not repeat old mistakes. Consider this: nine years ago this month, June, 2007, an unexpected event occurred: investment banking firm Bear Sterns (BS) had to bail out two of its hedge funds that were collapsing because of bad bets on subprime mortgages. At the time, there was no mystery surrounding the risks that were emerging, though 15 months later, there were complaints that the financial media had failed to sound the warning alarms.

In fact, the New York Times said the crisis at BS stemmed “directly from the slumping housing market and the fallout from loose lending practices that showered money on people with weak, or subprime, credit, leaving many of them struggling to stay in their homes. Bear Sterns averted a meltdown this time, but if delinquencies and defaults on subprime loans surge, Wall Street firms, hedge funds and pension funds could be left holding billions of dollars in bonds and securities backed by loans that are quickly losing their value.”

Let’s put that seemingly small BS event from nine years ago into context:

  • June 2007: BS Bails out funds
  • October 2007: US stock indexes hit all-time highs
  • March 2008: BS goes broke and is taken over by JP Morgan Chase
  • September 2008: Lehman Brothers Holdings files for Chapter 11 bankruptcy protection; Bank of America purchases Merrill Lynch; the Federal Reserve Bank of New York is authorized to lend up to $85 billion to AIG; the Reserve Primary Money Fund falls below $1 per share; Goldman Sachs and Morgan Stanley become bank holding companies

I am not suggesting that Brexit will cause a financial crisis, but we should carefully consider what dangerous spillover effects could occur. While US banks are better capitalized than they were leading up to the fall of 2008, the UK and European banks do not look nearly as healthy. In the two trading sessions after Brexit, the European Bank index lost about a quarter of its value and UK based banks did even worse.

If you are traveling to the UK or Europe or you enjoy imported cheese and wine, you might be delighted to see the US dollar strengthen. But as the dollar rises, emerging markets like China could come under pressure, echoing what happened in the first six weeks of the year, when global stocks tumbled and US stock corrected. And if European growth slows, its weaker economies (Portugal, Italy, Greece, Spain) will once again be at the heart of sovereign debt questions.

In terms of the US, analysts at Capital Economics say the UK and the EU account for 4 and 15 percent of US exports, respectively. If both regions go into a recession, Brexit could shave 0.2-0.3 percent from the current US growth rate of 2 percent. But estimates can be rocked by emotions. A US-based multinational may hold back on hiring everywhere to see how things shake out post-Brexit. For US exporters, the rising US dollar will create a drag on competitiveness in overseas markets and could potentially trigger lay offs at home. And if non-affected businesses and consumers start to feel unnerved, they too might pull in the reins, causing the US economy to slow down more than anticipated.

Amid all of this uncertainty, anxiety levels are rising, testing the third longest bull market in history. Some may feel butterflies and may even be tempted to sell. Remember that market timing rarely works because even if you sell and manage to steer clear of the bear by staying in cash, you will not be able to reinvest dividends and fixed-income payments at the bottom and you are likely to miss the eventual market recovery. There is clear evidence that when investors react either to the upside or downside, they generally make the wrong decision.

The best way to avoid falling into the trap of letting your emotions dictate your investment decisions is to remember that you are a long-term investor and do not have all of your eggs in one basket. Your diversified portfolio strategy, based on your goals, risk tolerance and time horizon should help you fight the urge to react to short-term market conditions. It’s not easy to do, but sometimes the best action is NO ACTION. And don’t forget that if you are still contributing to your retirement plan or funding your kid’s education fund, take comfort in knowing that you are buying shares at cheaper prices.

If you are really freaked out about the movement in your portfolio, perhaps you came into this period with too much risk. If that’s the case, you may need to trim readjust your allocation. If you do make changes, be careful NOT to jump back into those riskier holdings after markets stabilize. Finally, if you need access to your money in the short-term (within the next 6-12 months), be sure that it is not invested in an asset that can fluctuate.

Financial Crisis Anniversary: What Have we Learned?

Lehman-WSJ.png

This week marks the seventh anniversary of the financial crisis. Sometimes people forget just how close to the brink we were. Yes, the U.S. and global financial system was brought to its knees, but it did not crumble. To measure our progress, it might be helpful to remember just how intense it was in that first week.

  • 9/15/2008: Lehman Brothers Holdings filed for Chapter 11 bankruptcy protection; Bank of America announced its intent to purchase Merrill Lynch
  • 9/16/2008: The Federal Reserve Bank of New York lent $85 billion to AIG
  • 9/16/2008: The net asset value of shares in the Reserve Primary Money Fund fell below $1. When the fund “broke the buck,” it caused panic among investors who considered money market accounts nearly the equivalent of bank savings accounts
  • 9/19/2008: The Treasury Department announced that it would insure up to $50 billion in money-market fund investments. The year long initiative guaranteed that the funds' value would not fall below the $1 a share.
  • 9/21/2008: The Federal Reserve Board approved applications of investment banking companies Goldman Sachs and Morgan Stanley to become bank holding companies, so that they could access money from the Federal Reserve and to fund their daily operations

Many people thought that the government’s intervention was over the top. “Let them fail!” was the rallying cry, but I always believed that saving the system was paramount, even if I did not necessarily agree with the terms of the various bailout deals (I thought that taxpayers should have gotten more of the upside of the financial service companies’ recovery, rather than simply receiving a repayment of the dollars, with interest) and the government’s more than $800 billion stimulus plan (“The American Recovery and Reinvestment Act of 2009"). Still, while both of the shotgun measures could have been more effective, they likely helped the country avert what could have been a Depression, rather then the horrible recession that we endured. The so-called Great Recession, which started in December 2007 and concluded in June 2009, was the worst contraction since the Great Depression.

Seven years later, what have we learned? Because the financial crisis stemmed from too much easy borrowing and lending in the housing market, one of the best lessons was the concept that borrowing can be dangerous. Just because some bank is willing to lend you a lot of money to buy a house or will extend to you a giant credit card limit, does not mean that you should take it. For most people, putting down a 20 percent down payment for a house is prudent. Even if FHA will allow borrowers to put down less than 10 percent to qualify for a mortgage, there is a good reason that the 20 percent down rule of thumb exists: just in case the housing market collapses, you have more equity in the house. Similarly, even if you have the ability to buy a lot of fun stuff on your credit card, you should only be charging what you can pay off on a monthly basis.

A corollary of the loan warning is to read the fine print on all documents. There were too many instances when borrowers really did not understand the terms of the loans that they were assuming. Although many regulations now require more transparency and disclosure on everything from mortgages to credit card statements, after the financial crisis we still must be vigilant in reviewing documents to protect ourselves.

The crisis taught us that an adequate emergency reserve fund (6 to 12 months of expenses for those who were employed and 12 to 24 months for those who were retired) could prevent us from selling assets at the wrong time and/or from invading retirement accounts. And of course for investors, we learned that a diversified asset allocation plan, that takes into consideration your risk tolerance and when you need to access your funds can prevent a lot of sleepless nights. Nobody wants to test these lessons any time soon, but let’s heed them.

Financial Crisis Anniversary: A Short History of QE

8459494805-b63e1a966d-z.jpg

Happy Anniversary! Six years ago this week, the US financial system was brought to its knees. Over the course of seven days, Lehman Brothers filed for bankruptcy; Bank of America said it would buy Merrill Lynch; Goldman Sachs and Morgan Stanley became bank holding companies; the Federal Reserve bailed out insurance giant AIG; the Treasury Department had to insure money-market funds; and the government submitted its first draft legislation of TARP. Yeah, that all happened in one week! Two months after that momentous week, the economic downturn, which started in December 2007, accelerated. In an effort to create liquidity in the bond market and to help rescue the economy from plunging into the abyss, the Federal Reserve took the aggressive and unusual step of buying mortgage backed bonds, and eventually expanded the program to include government bonds.

As a reminder, here’s a short history of the central bank’s bond buying stimulus plan, known as “Quantitative Easing” or “QE”:

  • November 2008: The first 15-month period of QE begins with purchases of mortgage securities, later expanded to include Treasury debt
  • August 2010: Fed launches QE2 with a defined $600B target
  • June 2011: Fed completes QE2
  • September 2011: Fed announces “Operation Twist,” which allows the central bank to swap short term Treasuries for long-term ones
  • September 2012: Fed launches QE3 and extends its intention to maintain low short-term interest rates until mid-2015
  • December 2012: Fed announces that QE3 would be open-ended at $85B/month and that outright Treasury purchases would replace Operation Twist.
  • June 2013: Fed Chair Bernanke announces that QE would wind down later in 2013 and would likely conclude by mid-2014, provided that the economy improves
  • December 2013: Fed officials began the process of unwinding their bond-buying program by reducing purchases by $10 billion dollars to $75 billion

Six years later, the Fed strategy continues, but the central bank is in the process of unwinding the third version of that bond-buying program. The central bank will conduct a two-day policy meeting this week, where it is widely expected to announce another $10 billion cut, reducing monthly purchases to $15 billion. If you are doing your Fed math (or can subtract), you will quickly realize that QE3 will likely end at the October 29th meeting.

And just like that, the Fed will have undone its historic policy and will return to its more mundane tool of manipulating short-term interest rates to fight inflation.

Remember way back in March, when Janet Yellen made her first and now-famous snafu? She said that the central bank might start increasing short-term rates “six months” after the conclusion of QE3, which would put the first hike in April of next year. Investors freaked out and sold stocks and bonds, because that time horizon was sooner than previously projected.

Those who think rationally might think, “If the data show that the economy is improving and as a result, the Fed increases short term interest rates, isn’t that a good thing?” You might think so, but so much of the recovery stock market rally has been predicated on zero percent interest rates, which have made equities the most favored asset class.

So how will markets react to higher rates? According to Capital Economics, “The S&P 500 rose by an average of about 5 percent in the six months before the first rate hike in each of the last seven major tightening cycles [1971, 1976, 1984, 1986, 1994, 1999, 2004]…And it also gained an average of about 5 percent in the nine months after the first hike.”

That said, it’s hard to count on the rally continuing indefinitely and although nobody wants to say it, this time is different, since this rate hike cycle follows a once-in-a-generation financial meltdown and large-scale asset purchases by the Fed. Fasten your seat belts…it’s going to be a bumpy ride.

MARKETS: Stock indexes snapped a 5-week winning streak.

  • DJIA: 16,987 down 0.9% on week, up 2.5% YTD
  • S&P 500: 1985, down 1.1% on week, up 7.4% YTD
  • NASDAQ: 4467, down 0.3% on week, up 9.4% YTD
  • 10-Year Treasury yield: 2.61% (from 2.46% a week ago)
  • October Crude Oil: $92.27, down 1% on the week
  • December Gold: $1231.50, down 2.8% on the week
  • AAA Nat'l average price for gallon of regular Gas: $3.40 (from $3.54 a year ago, lowest since Feb)

THE WEEK AHEAD:

Mon 9/15:

OECD releases its global economic outlook

8:30 Empire State Manufacturing

9:15 Industrial Production

Tues 9/16:

8:30 Producer Price Index

FOMC 2-day policy meeting begins

Weds 9/17:

8:30 Consumer Price Index

10:00 Housing Market Index

2:00 FOMC concludes/Fed economic projections

2:30 Fed Chair Yellen Press Conference

Thurs 9/18:

8:30 Weekly Jobless Claims

8:30 Housing Starts

10:00 Philadelphia Fed Survey

Alibaba prices its IPO – could be largest IPO in US history

Scotland votes on a referendum on independence, which would break up the 307-year-old U.K. and plunge Britain into a constitutional crisis. Voting concludes at 5:00pm ET

Fri 9/19:

Apple releases iPhone6

10:00 Regional/State Unemployment

Quadruple Witching: simultaneous expiration stock index futures, individual stock futures, stock index options and individual stock options

Sat 9/20

G-20 finance ministers and central bankers meet in Cairns, Australia

Fed Transcripts: Economists can be funny too!

8017948927_157696f78f.jpg

Wouldn’t you hate it if you were to come upon a transcript of what you said, as you navigated a difficult time in your life? Now imagine what it would be like if that transcript was released publicly -- chances are, you would wish you could rewrite history. Alas and alack, without the ability to go back in time, you would be stuck with your mate or your dear friend saying, “Well, you did the best you could during a rough patch.” Those thoughts went through my head as I poured over the 2008 FOMC transcripts and then read all of the second-guessing by the financial press and various pundits. The bottom line is that not only was the Fed slow to realize the gathering storm in 2007 (In May 2007, Ben Bernanke said “We believe the effect of the troubles in the subprime sector on the broader housing market will likely be limited, and we do not expect significant spillovers from the subprime market to the rest of the economy or to the financial system”), but when the once-in-a-generation storm made landfall in 2008, the Fed was caught flat-footed and “behind the curve,” according to Chairman Bernanke in January 2008.

For much of the spring and summer, some Fed officials thought the worst was over. In August, St Louis Fed President James Bullard said, “My sense is that the level of systemic risk associated with financial turmoil has fallen dramatically” and even Janet Yellen, who was prescient about the severity of the crisis earlier in the year and predicted recession before the NBER declared it so, momentarily took her eyes off the ball and worried unnecessarily about inflation.

OK, but that’s really cherry-picking the worst quotes from the year. (For the record, it appears that Boston Fed President Eric Rosengren may have been the most spot-on with his analysis of the crisis.)  In the last third of the year, circumstances demanded swift and decisive action and Fed officials rose to the occasion by slashing interest rates, buying bonds and implementing a variety of strategies to prop up the US and global economies.

Spoiler alert: The best part of reading through the transcript was to discover that some central bankers actually have a sense of humor. Frederick Mishkin invoked Monty Python’s “Look on the Bright Side of Life,” Donald Kohn quipped “Anyone who thinks he or she understands what’s going on is either a lot smarter than I am or delusional — or both” and Janet Yellen provided a bit of Halloween humor during an October meeting, when she said: “We have had a witch’s brew of news. Sorry. The downward trajectory of economic data has been hair-raising — with employment, consumer sentiment, spending and orders for capital goods, and home building all contracting — and conditions in financial and credit markets have taken a ghastly turn for the worse.”

HAHAHAHAHAHA…those crazy Fed officials!

MARKETS: The quiet, holiday-shortened week was highlighted by two technology sector deals: the maker of Candy Crush Saga is going public and Facebook is paying $19 billion for WhatsApp.

  • DJIA: 16,103, down 0.3% on week, down 2.9% YTD
  • S&P 500: 1836, down 0.1% on week, down 0.7% YTD
  • NASDAQ: 4263, up 0.5% on week, up 2.1% YTD
  • 10-Year Treasury yield: 2.73% (from 2.75% a week ago)
  • Apr Crude Oil: $102.20, up 2% on week
  • April Gold: 1323.60, up 0.4% on week
  • AAA Nat'l average price for gallon of regular Gas: $3.40 (from $3.78 a year ago)

THE WEEK AHEAD: As we enter the third year of the housing recovery, two reports on real estate prices are expected to confirm that increases are slowing down from last year’s brisk pace. But the old saying “location, location, location” may still hold. According to HSH.com, housing affordability varies dramatically across the country. For instance, you need an annual salary of about $20,000 to afford a median home in Cleveland, but you have to earn a whopping $115,000 if you are seeking a median-priced home in the San Francisco area.

Mon 2/24:

8:30 Chicago Fed National Activity Index

10:30 Dallas Fed Mfg Survey

Tues 2/25:

Home Depot, Macy’s, T-Mobile

9:00 Case Schiller Home Price Index

9:00 FHFA Home Price Index

10:00 Consumer Confidence

Weds 2/26:

JC Penney, Target

10:00 New Home Sales

Thurs 2/27:

Best Buy, Kohls, Sears

8:30 Weekly Jobless Claims

8:30 Durable Goods Orders

10:00 Fed Chair Janet Yellen testifies before the Senate Banking Committee

Fri 2/28:

Berkshire Hathaway

8:30 Q4 GDP – 2nd estimate (1st estimate=3.2%)

9:45 Chicago PMI

9:55 U Michigan Sentiment Index

10:00 Pending Home Sales

Radio Show #133: Fed Fake-out!

JSminibrand1.png

The Federal Reserve shocked economists and investors by maintaining its $85 billion bond-buying program. Listeners were more interested in kick-starting their retirement savings and putting their cash to work.

  • Download the podcast on iTunes
  • Download the podcast on feedburner
  • Download this week's show (MP3)

Elizabeth from RI and Nick from NY are in their 20’s, living home and saving lots of money. They both needed help with figuring out how to start investing for retirement.

Judy from CO, Alma from AZ and Mel from MN all have a great problem: where to invest cash? Both Susan and Bonnie had allocation questions, which JM from New York City, asked about the Windfall Elimination Penalty provision.

As Mayor Rahm Emanuel once said, “You never want a serious crisis go to waste. And what I mean by that is an opportunity to do things you think you could not do before.” While Emanuel was talking about politics, we can apply his statement to investor behavior leading up to and during the financial crisis. With five years of distance from the eye of the storm, here is my list of the top 5 lessons every investor can take away:

1. Keep cool: There are two emotions that influence our financial lives: fear and greed. At market tops, greed kicks in and we tend to assume too much risk. Conversely, when the bottom falls out, fear takes over and makes us want to sell everything and hide under the bed. If you had sold all of your stocks during the first week of the crisis in September 2008, you would have been shielded from further losses (stocks bottomed out in March 2009). But how would you have known when to get back in? It is highly doubtful that most investors would have had the guts to buy when it seemed like stock indexes were hurtling towards zero.

2. Maintain a diversified portfolio…and don’t forget to rebalance. One of the best ways to prevent emotional swings is to create and adhere to a diversified portfolio that spreads out your risk across different asset classes, such as stocks, bonds, cash and commodities. In September 2008, a client shrieked to me that “everything is going down!” But that was not exactly the case: the 10 percent allocation in cash was just fine, as was the 30 percent holding in government bonds. That did not mean that the stock and commodities positions were doing well, but overall, the client was in far better shape because she owned more than risk assets.

3. Maintain a healthy emergency reserve fund. Bad luck can occur at any time. One great lesson of the crisis is that those who had ample emergency reserve funds (6 to 12 months of expenses for those who were employed and 12 to 24 months for those who were retired) had many more choices than those who did not. While a large cash cushion seems like a waste to some (“it’s not earning anything!”), it allowed many people to refrain from selling assets at the wrong time and/or from invading retirement accounts. Side note: the home equity lines of credit on which many relied for emergency reserves vanished during the crisis.

4. Put down 20 percent for a mortgage (and try to stick to plain vanilla home loans (15 or 30 year fixed rate mortgages), unless you really understand what you are doing!) Flashback to 2004 – 2007 and you will likely recall that you or someone you knew was buying a home or refinancing with some cockamamie loan that had “features” that allowed borrowers to put down about 3 cents worth of equity. There’s a good reason that old rules of thumb work. Yes Virginia, house prices can go down. And despite the recovery, please shun the advice from so-called experts like Suze Orman, who are once again saying that 10 percent down is just fine.

5. Understand what is in your target date fund: Pre-crisis, many investors had started to use target date funds, in which the fund manager “targets” your future date of retirement and adjusts the allocation as you near the time that you will need to access the money. Unfortunately, many of these funds were far riskier than investors understood. Whether it’s a target date fund or an age-based investment for your kid’s college fund, be sure to check out the risk level before you put a dollar to work.

Thanks to everyone who participated and to Mark, the BEST producer in the world. If you have a financial question, there are lots of ways to contact us:

  • Call 855-411-JILL and we'll schedule time to get you on the show LIVE 

Financial Crisis Anniversary: 5 Investor Lessons

5066943664_3233857f2e.jpg

Five years ago, when the financial crisis blew across the nation like a massive storm, it left a wake of destruction in its path. The Federal Reserve Bank of Dallas estimates that the total cost of the crisis (assuming economic output eventually returns to its pre-crisis trend), to be between $6 and $14 trillion. To put those big numbers into perspective, the loss amounts to $50,000 to $120,000 for every U.S. household. Ouch! The crisis tested every investor, from the neophytes to the most jaded traders on the street. With five years of distance from the eye of the financial storm, here is my list of the top 5 lessons every investors can take away:

1. Keep cool: There are two emotions that influence our financial lives: fear and greed. At market tops, greed kicks in and we tend to assume too much risk. Conversely, when the bottom falls out, fear takes over and makes us want to sell everything and hide under the bed. If you had sold all of your stocks during the first week of the crisis in September 2008, you would have been shielded from further losses (stocks bottomed out in March 2009). But how would you have known when to get back in? It is highly doubtful that most investors would have had the guts to buy when it seemed like stock indexes were hurtling towards zero.

2. Maintain a diversified portfolio…and don’t forget to rebalance. One of the best ways to prevent emotional swings is to create and adhere to a diversified portfolio that spreads out your risk across different asset classes, such as stocks, bonds, cash and commodities. In September 2008, a client shrieked to me that “everything is going down!” But that was not exactly the case: the 10 percent allocation in cash was just fine, as was the 30 percent holding in government bonds. That did not mean that the stock and commodities positions were doing well, but overall, the client was in far better shape because she owned more than risk assets.

3. Maintain a healthy emergency reserve fund. Bad luck can occur at any time. One great lesson of the crisis is that those who had ample emergency reserve funds (6 to 12 months of expenses for those who were employed and 12 to 24 months for those who were retired) had many more choices than those who did not. While a large cash cushion seems like a waste to some (“it’s not earning anything!”), it allowed many people to refrain from selling assets at the wrong time and/or from invading retirement accounts. Side note: the home equity lines of credit on which many relied for emergency reserves vanished during the crisis.

4. Put down 20 percent for a mortgage (and try to stick to plain vanilla home loans (15 or 30 year fixed rate mortgages), unless you really understand what you are doing!) Flashback to 2004 – 2007 and you will likely recall that you or someone you knew was buying a home or refinancing with some cockamamie loan that had “features” that allowed borrowers to put down about 3 cents worth of equity. There’s a good reason that old rules of thumb work. Yes Virginia, house prices can go down. And despite the recovery, please shun the advice from so-called experts like Suze Orman, who are once again saying that 10 percent down is just fine.

5. Understand what is in your target date fund: Pre-crisis, many investors had started to use target date funds, in which the fund manager “targets” your future date of retirement and adjusts the allocation as you near the time that you will need to access the money. Unfortunately, many of these funds were far riskier than investors understood. Whether it’s a target date fund or an age-based investment for your kid’s college fund, be sure to check out the risk level before you put a dollar to work.

Radio Show #132: Investing for the Post-Crisis Era

JSminibrand1.png

Over the course of one week five years ago, the U.S. financial system was brought to its knees. Throughout the show, I tell you where we stand five years after this momentous week, when it comes to jobs, income, housing, stocks and much more!

  • Download the podcast on iTunes
  • Download the podcast on feedburner
  • Download this week's show (MP3)

To recap the action over that horrible 7-day period in September 2008:

  • 4 investment banks vanished (Lehman Brothers declared bankruptcy, Bank of America swallowed the ailing and near-failing Merrill Lynch, and Goldman Sachs and Morgan Stanley were forced to become bank holding companies in order to access the government’s discount window)
  • The government bailed out global insurance giant AIG
  • There was panic in the money market fund industry after the Reserve Primary Money Fund “broke the buck,” dropping below the standard $1 per share valuation
  • The Treasury Department introduced the first version of TARP, which was intended to grant the government the authority to purchase $700 billion of mortgage-related assets for two years.

Meanwhile, listeners were equally as interested in NOT repeating past financial mistakes. Margaret from MA started us off with a question about where to invest the proceeds of a CD that is coming due. Kevin followed up with a retirement planning question: how to create a stream of income from a $500K nest egg?

Joe from IN needs to access funds for his daughter’s education: which should he tap first?

Reeves from MO and John from KY are both in their 20’s and starting their first retirement accounts. We discuss their options and the advantages/disadvantages of 401 (k)s and Roth IRAs.

William from WI wrote in about a good problem: a large estate. If you are fortunate to have an estate larger than $5.25 million (for individuals) there are a number of options for addressing your potential estate tax.

Thanks to everyone who participated and to Mark, the BEST producer in the world. If you have a financial question, there are lots of ways to contact us:

  • Call 855-411-JILL and we'll schedule time to get you on the show LIVE 

Week ahead: Financial Crisis Anniversary: Where We Stand

2917292824_caccb179ce.jpg

Over the course of one week five years ago, the U.S. financial system was brought to its knees. As a reminder of just how bad that week was, consider this timeline:

  • 9/15/2008: Lehman Brothers Holdings filed for Chapter 11 bankruptcy protection. On the same day, Bank of America announced its intent to purchase Merrill Lynch for $50 billion.
  • 9/16/2008: The Federal Reserve Board authorized the Federal Reserve Bank of New York to lend up to $85 billion to AIG under Section 13(3) of the Federal Reserve Act.
  • 9/16/2008: The net asset value of shares in the Reserve Primary Money Fund fell below $1 per share, primarily due to losses on Lehman Brothers commercial paper and medium-term notes. When the Reserve fund “broke the buck,” it caused panic among investors who considered money market accounts nearly the equivalent of bank savings accounts.
  • 9/19/2008: To guard against a run on money market funds, the Treasury Department announced that it would insure up to $50 billion in money-market fund investments at companies that paid a fee to participate in the program. The year long initiative guaranteed that the funds' values would not fall below the $1 a share.
  • 9/20/2008: The Treasury Department submitted draft legislation to Congress for authority to purchase troubled assets (the first version of TARP).
  • 9/21/2008: The Federal Reserve Board approved applications of investment banking companies Goldman Sachs and Morgan Stanley to become bank holding companies.

Over the course of one week, four investment banks were gone (one absorbed, one went broke and two were forced to become bank holding companies); a global insurance company was bailed out; the money market fund industry was rocked; and the Treasury Department introduced the first version of TARP, which granted authority to purchase $700 billion of mortgage-related assets for two years.

Where do we stand five years after this momentous week?

Jobs: In September 2008, the unemployment rate was 6.1 percent, on its way up to 10 percent in October 2009. The rate now stands at 7.3 percent. Despite progress during the recovery, the economy still has 1.9 million fewer jobs than it did before the recession. At the recent pace of job growth it will take just under 11 months to reach the previous peak.

Income: For those lucky enough to have jobs, the financial crisis and recession put a dent in median household income. According to Sentier Research, July 2013 median household income ($52,113), adjusted for inflation, was 6.2 percent lower than December 2007 ($55,569), the first month of the recession. Incomes are 5 percent lower than in September 2008. It may be cold comfort to consider that the recession exacerbated a trend that was already occurring: July 2013 median was 7.3 percent lower than the median in January 2000 ($56,233), the beginning of the statistical series.

Economic growth: In the fourth quarter of 2008, when the impact of the financial crisis was cascading through the system, Gross Domestic Product dropped by 8.3 percent. For all of 2008, GDP slid 0.3 percent, followed by a 2.8 percent drop in 2009. The official end of the recession (as determined by the Dating Committee of the National Bureau of Economic Research) occurred in June 2009. While the total size of the US economy today ($15,681T) is larger than it was in Q3 2008 ($14.895T), the pace of the recovery has lagged the annual average post World War II growth rate of 3-3.5 percent.

Stocks: At the end of trading that first fateful week of the financial crisis, the damage wasn’t so bad, if you didn't have to live through the day-to-day swings. By Friday September 19, 2008 the Dow had dropped just 33 points to 11,388; the S&P 500 edged up 4 points to 1,255; and the NASDAQ was up 12 points to 2,273. Stocks bottomed out in March 2009 and then skyrocketed by nearly 150 percent to today’s near-record levels.

Housing: While stock markets bottomed out about six months after the Lehman Brothers bankruptcy, it took the epicenter of the crisis, the housing market, far longer. House prices peaked in 2006, then reached bottom in early 2012. National house prices are up nearly 16 percent from the post-bubble low, but still remain down over 23 percent from the peak. Currently, 14.5 percent of residential properties with a mortgage are still underwater (amount owed on mortgage is more than the home’s value), according to CoreLogic. The rate was down from the peak of 26 percent in the fourth quarter of 2009.

Bailouts: The government used extraordinary measures to save the financial system, including directly bailing out the financial and automobile industries. Of course, there were plenty of other measures that indirectly helped, liked providing financing through the Federal Reserve’s discount window for US banks, European banks and even for industrial conglomerates like General Electric. Here’s the accounting for some bailouts of note:

  • Fannie Mae/Freddie Mac: $188B bailout, of which the companies are expected to return $146B in dividends by Sep 2013.
  • GM and Chrysler: Of $80B committed, $51B repaid
  • TARP: Of $700B, most has been repaid with interest. CBO puts eventual taxpayer tab at $21B.
  • AIG: Fed and Treasury committed $182B, with taxpayers estimated to be fully repaid, plus $23B.

Regulatory: The Dodd-Frank Wall Street Reform and Consumer Protection Act was enacted in July 2010, but lawmakers left a lot of the hard work to regulators. According to law firm Davis Polk, as of September 3, 2013, a total of 280 Dodd-Frank rulemaking requirement deadlines have passed. Of these 280 passed deadlines, 172 (61.4 percent) have been missed and 108 (38.6 percent) have been met with finalized rules. In addition, 160 (40.2 percent) of the 398 total required rulemakings have been finalized, while 126 (31.7 percent) rulemaking requirements have not yet been proposed.

Too Big To Fail: There may be fewer banks, but they are even bigger than they were at the beginning of 2007. The combined assets of the “Big Six,” which include JP Morgan Chase, Bank of America, Citigroup, Wells Fargo, Goldman Sachs and Morgan Stanley, have increased by 28 percent, according to data compiled by Bloomberg. The good news is that they have much more capital on hand. The bad news is that they are still leveraged, complicated and interconnected institutions, which makes them prone to inflict damage on the overall financial system.

Who paid what? There have been billions of dollars worth of penalties, which were levied as a result of the financial crisis. Among the biggies, the SEC has collected $2.73B and the national mortgage settlement will rake in $25B from the nation’s five largest mortgage servicers.

Who went to jail? Nobody. Jail is for federal crimes and there have been no federal convictions that have arisen from the financial crisis. (Fraudsters like Bernie Madoff and Alan Stanford didn’t have a direct connection with the financial crisis.) On the civil side, the SEC has filed civil charges against 138 firms and individuals for alleged misconduct just before or during the crisis, according to The Wall Street Journal. The biggest fish the regulators tried to land was former Countrywide CEO Angelo Mozillo, who ultimately settled with the SEC to the tune of $67.5 million in fines and a lifetime ban from serving as an officer of a public company. Former Goldman Sachs employee Fabrice “Fabulous Fab” Tourre was found guilty of misleading investors in mortgage securities issued by his firm.

Bottom Line: Just in time for the five-year anniversary, the Federal Reserve Bank of Dallas released a bleak assessment of the cost of the crisis. “Our bottom-line estimate of, assuming output eventually returns to its pre-crisis trend path, is an output loss of $6 trillion to $14 trillion. This amounts to $50,000 to $120,000 for every U.S. household…This seemingly wide range of estimates is due in part to the uncertainty of how long it might take to return to the pre-crisis growth trend.”

But, wait it gets worse. The Fed economists note that the U.S. may never return to trend, which would put the cost ABOVE $14 trillion. HAPPY ANNIVERSARY!

MARKETS:

  • DJIA: 15,376 up 3% on week, up 17.3% on year (2nd best week of the year)
  • S&P 500: 1688, up 2% on week, up 18.4% on year (within 1.3% of its Aug. 2 all-time nominal high)
  • NASDAQ: 3722, up 1.7% on week, up 23.3% on year
  • 10-Year Treasury yield: 2.89% (from 2.94% a week ago)
  • Oct Crude Oil: $108.21, down 2% on week
  • Dec Gold: $1308.60, down 5.6% on week
  • AAA Nat'l average price for gallon of regular Gas: $3.54

THE WEEK AHEAD: Here comes the Fed…the central bank will conduct a two-day confab, where most economists expect an announcement of a small pull back in monthly bond purchases (from $85B to $75B). Let the taper begin!

Mon 9/16:

8:30 Empire State Manufacturing

9:15 Industrial Production

Tues 9/17:

FOMC Begins

8:30 CPI

10:00 Housing Market Index

Weds 9/18:

2:00 FOMC Announcement/FOMC Forecasts

2:30 Bernanke Press Conference

Thurs 9/19:

8:30 Weekly Jobless Claims

10:00 Existing Home Sales

10:00 Philadelphia Fed

Fri 9/20:

Quadruple Witching: The expiration of stock index futures, stock index options, stock options and single stock futures…can lead to increased volatility.

New iPhones in stores