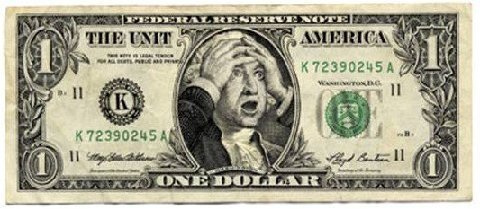
Fed taper

Week Ahead: Back to Work for Wall Street

11648925573_27f6e9da7a.jpg

Wrapping up the year in one post is tough, but let’s give it a try. Although the financial industry likes to think that the center of the universe is located somewhere between lower Manhattan and the hedge fund enclave of Greenwich, CT, most of 2013 was dominated by events in Washington DC. Fiscal Cliff: The year started with a cliffhanger Congressional vote that occurred 90 minutes after the January 1 “fiscal cliff” deadline. The agreement raised roughly $600 billion in taxes over 10 years, by increasing contributions to Social Security  from 4.2 percent, back to 6.2 percent on earnings up to $113,700; and by increasing taxes for wealthy Americans.

Sequestration: The genesis of the automatic $1.2 trillion in spending cuts, known as “sequestration,” occurred in August 2011, when lawmakers were battling over raising the debt ceiling. When the  “supercommittee” failed to devise an alternative to avert across-the-board cuts to defense and non-defense programs, the government was forced cut $110 billion from its budget, starting on March 1st.

Economists warned that the combination of tax increases and spending cuts would reduce growth, which is exactly what occurred. Q1 came in at a measly 1.1 percent annualized pace, but as the year advanced, things picked up. GDP advanced to 2.5 percent in Q2 and then to a sizzling 4.1 percent in the third. The economy likely expand by about 2.25 to 2.5 percent for the year, a bit ahead of the worrywart predictions, but still about one percent slower than the post-World War II average of 3.3 percent.

Bernanke’s Taper Talk: During Fed Chairman Ben Bernanke’s May 22nd testimony on Capitol Hill, he said that the central bank could taper its $85 billion monthly bond-buying program, if the economy were to perk up. The stock and bond markets fell on the suggestion that the central bank would remove stimulus from the economy, though the stock market recovered and eventually moved higher. By the time the Fed finally announced the dreaded taper at its last policy meeting of the year, investors took the news in stride and bought stocks. However, the bond market suffered a lasting blow: the yield on the 10-year treasury soared from 1.62 percent in the beginning of May to a two-year high of 3 percent and pushed down the value of bonds.

Government shutdown/Debt Ceiling: Budget fights are like clockwork, but 2013’s drama led to a partial government shutdown from Oct 1 - 16. Lawmakers finally agreed on a deal to reopen for business and to raise the debt ceiling, averting what the Treasury Department said would be an unprecedented and potentially catastrophic default.

Housing Recovery: 2013 was a big turning point for the US real estate market. The combination of low interests rates and bargain-basement prices brought big investors into the fray. The result was a 13 percent increase in home prices this year and a big uptick in activity. The pace of price gains will likely slow in 2014, due to higher mortgage rates and an increase in inventory, but single-digit increases would be increases nonetheless.

Stocks Soar: The Federal Reserve’s low interest rate policy and bond buying program made stocks the go-to asset class for investors. (See below for 2013 totals.)

First FULL WEEK of 2014: It’s back to work for Wall Street, after two consecutive holiday-shortened weeks. No time to gloat over those big gains for stocks, because this week the focus will be on Friday’s December jobs report. Economists are hoping to build on the strength of the past few months, when monthly job creation averaged over 200,000.

The economy added nearly 2.1 million jobs through November and with December expected to show an increase of about 200,000, total monthly job creation for the year is expected to be 190-195,000, a slight improvement from the 183,000 in 2012. The unemployment rate should remain at a five-year low of 7 percent. As a reminder, unemployment  was at 5 percent in December 2007, the month that the Great Recession officially started. It doubled to 10 percent at the end of 2009, before starting to drop.

Investors will also eye the minutes from the Fed's December policy meeting, when the central bank announced a $10 billion reduction in monthly bond-buying. There will be interest in whether Fed officials discussed the pace of future reductions.

MARKETS 2013:

  • DJIA: 16,576, up 26.5% on year (including dividends: 29.7%)
  • S&P 500: 1848, up 29.6% on year (including dividends: 32.4%)
  • NASDAQ: 4176, up 38.3% on year (including dividends: 40.1%)
  • Nikkei 225: up 57% (remains 40% below all-time high in 1989)
  • Venezuelan Stock market: up 480%, best performer worldwide
  • China’s Shanghai Composite: down 6.7 percent
  • Brazilian Bovespa: down 15 percent
  • 10-Year Treasury yield: 3.03% (including interest: down 1.3%)
  • Barclay’s US Aggregate Bond Index, down 2.02% (first decline since 1999)
  • Feb Crude Oil: $98.42, up 9.3%
  • Feb Gold: $1202.30, down 28.7% (first losing year in 13)
  • AAA Nat'l average price for gallon of regular Gas: $3.32 (from $3.30 a year ago)

THE WEEK AHEAD:

Mon 1/6:

10:00 Factory Orders

10:00 ISM Non-Mfg Index

Tues 1/7:

8:30 International Trade

Weds 1/8:

8:15 ADP Private Sector Jobs

2:00 FOMC Minutes

3:00 Consumer Credit

Thurs 1/9:

8:30 Weekly Jobless Claims

Fri 1/10:

8:30 December Jobs Report

Week Ahead: Asset Class Envy

6269739839_8a8086701b.jpg

With all of the celebrations over stock market records these days, you might think that investors are once again partying like it’s the nineties. But most investors learned hard lessons in the near two decades since those halcyon days. The 1990’s-2000 Internet boom and bust, followed by the 2000’s housing boom and bust, along with a once-in-a-generation financial crisis and two associated stock market crashes, cured most investors of their stock-only portfolios. They soon learned the beauty of a diversified portfolio, which can provide comfort during stormy periods of time. But those diversified portfolios are not nearly as comforting when stocks are soaring and bond and commodity markets are falling. That’s why when many investors review their year-end statements, their total gains are likely to be much less than the 30 percent returns of the S&P 500. The main culprit is the bond market, which has taken it on the chin in 2013. The price of the 10-year Treasury has dropped precipitously this year, as yields have soared from a springtime low of 1.62 percent to 3 percent on Friday. The result is a total loss in return of about 2.7 percent for an asset class known as a "safe haven"!

Analysts note that the rise in rates is occurring for a good reason: the economy is strengthening and as a result, the Federal Reserve can slowly get out of the stimulus business. That may be cold comfort for diversified investors, who no doubt are feeling a bit of asset class envy right about now. Let’s just hope that they do not bail out of bonds and jump into stocks at the wrong time, which in hindsight can seem like premature reallocation.

Worrying about losses in bond positions probably seems like a pretty good problem to have, if you are one of the 1.3 million Americans who have just seen long-term unemployment benefits expire. The benefit has paid an average of $300 per week for up to an additional 47 weeks for those who have exhausted the roughly 26 weeks of unemployment benefits that most states provide.

Late last week, Sen. Jack Reed (D-RI) announced plans to introduce a three-month extension of  long-term unemployment benefits, and is aiming for a procedural vote as soon as January 6. The $6.5 billion proposal would maintain aid for recipients, who would have their benefits restored retroactively, while buying legislators more time to work out a longer extension. Costs for a full year of extending the benefits are estimated at $25 billion, according to CBO.

Reed has his work cut out for him: Many lawmakers are reluctant to extend benefits unless other cuts are proposed to offset them. Economists caution that cutting long-term unemployment benefits could reduce first quarter GDP by 0.2-0.4 percent.

MARKETS:

  • DJIA: 16,478 up 1.6% on week, up 25.7% on year
  • S&P 500: 1841, up 1.3% on week, up 29% on year
  • NASDAQ: 4156, up 1.3% on week, up 37.7% on year
  • 10-Year Treasury yield: 3% (from 2.89% a week ago)
  • Jan Crude Oil: $100.32, up 1% on week
  • Feb Gold: $1214, up 0.9% on week
  • AAA Nat'l average price for gallon of regular Gas: $3.30

THE WEEK AHEAD: The trading week between Christmas and New Year’s is often the lowest volume week of the year. With New Year’s Day falling mid-week, expect the first two trading sessions of 2014 to be equally quiet. Reports from the nation’s housing market, are expected to confirm that the sector is closing out a strong year. The Conference Board’s confidence index is expected to recover from October’s steep drop and November’s slide, both of which were probably due to the government shutdown and debt ceiling drama.

Mon 12/30:

10:00 Pending Home Sales

Tues 12/31:

9:00 Case-Schiller Home Price Index

9:45 Chicago PMI

10:00 Consumer Confidence

Bond markets close early, while stock markets have regular hours

Weds 1/1: GLOBAL MARKETS CLOSED FOR NEW YEAR’S DAY

Hold the sarcasm: Greece assumes the EU presidency from Lithuania

Thurs 1/2:

8:30 Weekly Jobless Claims

10:00 ISM Manufacturing

10:00 Construction Spending

Fri 1/3:

Motor Vehicle Sales


Week Ahead: Fed Proclaims “Let the Good Times Roll!”

photo-11.jpg

For the first time in five years, the Fed shifted policy and guess what? The world kept spinning! In fact, stocks soared on the news that the central bank would reduce its monthly bond purchases by $10 billion to $75 billion and keep short-term interest rates at rock-bottom levels. I guessed last week, that “Given what the Fed has told us, now would seem to be the right time to start unwinding the policy. If there is a change to policy, it’s not likely to be anything to dramatic-probably a reduction of $10 to 15 billion per month, evenly split between treasury securities and mortgage-backed securities.” What I did not anticipate was a central bank Christmas bonus: not only would the pull-back in bond buying occur slowly, but the Fed plans to keep short-term interest rates at near zero, even after the unemployment rate dropped below 6.5 percent, which likely means that rates will stay low at least for another year.

Put a different way, it’s like your parents announcing that they will reduce the proof of the punch bowl booze from 85 to 75 AND the party will continue right through next year! Sure, the festivities may not be quite as much fun in six months from, when the proof drops to 45, but for now, let the good times roll (h/t The Cars)!

MARKETS: Finally, a REAL milestone. The Dow hit a new inflation-adjusted high on Friday. The blue chip index had to reach 16,186.39 to have the same buying power (based on CPI) it had when it was worth 11,722.98 on January 14, 2000, according to the WSJ.

  • DJIA: 16,221 up 3% on week, up 23.8% on year
  • S&P 500: 1818, up 2.4% on week, up 27.5% on year (best week since July, on track for best year since 1997)
  • NASDAQ: 4104, up 2.6% on week, up 36% on year (18% below 3/00 all-time high of 5,048)
  • 10-Year Treasury yield: 2.89% (from 2.87% a week ago)
  • Jan Crude Oil: $99.32, up 2.5% on week
  • Feb Gold: $1203.70, down 2.5% on week, down 28% on year (on track for first annual decline in 13 years)
  • AAA Nat'l average price for gallon of regular Gas: $3.24

THE WEEK AHEAD: Take a load off…it should be a quiet, holiday-shortened week!

Mon 12/23:

8:30 Personal Income and Spending

8:30 Chicago Fed National Activity

9:55 Consumer Sentiment

Tues 12/24:

8:30 Durable Goods Orders

9:00 FHFA Home Price Index

10:00 New Home Sales

1:00 Markets close early Christmas Eve

Weds 12/25: GLOBAL MARKETS CLOSED FOR CHRISTMAS

Thurs 12/26:

8:30 Weekly Jobless Claims

Fri 12/27:

Sat 12/28:

Long-term unemployment benefits expire for 1.3 million Americans

Week Ahead: Federal Reserve Nerve

4812779637_3311c08e5c.jpg

Will they have the nerve to do it or won’t they? For the last time in 2013, investors and economists are wondering whether or not the Federal Reserve will finally pull the trigger and announce a reduction in its monthly bond purchases (aka “Quantitative Easing” or “QE3”). According to my non-scientific poll, odds are running at about 50-50. Those who say that the Fed will act, point to the September FOMC meeting rationale that Ben Bernanke laid out for why the central bankers maintained the status quo. At the time, he cited three concerns that put taper talk on hold: (1) the labor market was still weak (2) the recent rise in interest rates could slow down the economy and (3) lawmakers in DC could throw everything for a loop.

In the subsequent three months, there has been positive movement on all fronts.

  1. Employment: Job growth has accelerated, boosting the average monthly gain to over 200,000 for the past three months. Additionally, the unemployment rate has dropped to 7 percent. Way back in June, Bernanke said that an unemployment rate of 7 percent could be a trigger for pulling back on the Fed’s stimulus.
  2. Economic slowdown: Despite higher interest rates, the economy is picking up steam. Q3 GDP was revised higher to an annualized pace of 3.6 percent; November retail sales were stronger than expected; and the increase in home and stock prices are combining to increase the so-called “wealth effect,” which should encourage more consumer spending.
  3. DC Drama Queens: It may have been a small budget deal, but it was a deal. Congress agreed to increase spending by $63 billion over two years, with the caveat that there will be more than $22 billion in deficit reduction over the next decade. While lawmakers reserve the right to screw things up over the long-term, the short-term pressure is off.

Despite the progress, doubters note that the Fed is still worried that the labor market is not sufficiently healed and that the drop in rate is occurring not just because employment is rising, but also because people are leaving the labor force. Additionally, there is lingering concern that the low level of inflation is causing anxiety among some central bankers. Then there’s the theory that the Fed may wait until Janet Yellen takes over as Chairman in January, before retreating from five consecutive years of aggressive action. (The Senate is expected to vote on Yellen’s nomination this week.)

Given what the Fed has told us, now would seem to be the right time to start unwinding the policy. If there is a change, it’s not likely to be anything to dramatic-probably a reduction of $10 to 15 billion per month, evenly split between treasury securities and mortgage-backed securities.

Aside from the Fed meeting, there will also be news from the real estate market. Analysts say that the housing recovery is entering a new phase. The recent rapid rise in prices, which was driven by strong investment buying and tight supply conditions, will soon start to moderate as higher mortgage interest rates and increased inventory slow down progress. The recovery may take a breather, but it is likely to remain intact.

MARKETS: Boo-hoo…two consecutive weeks of losses is nothing compared to the massive year-to-date gains of 20 to 30 percent for stocks. As a reminder, the current bull market began in March 2009 and the S&P 500 is up 162 percent since then.

  • DJIA: 15,755 down 1.7% on week, up 20.2% on year
  • S&P 500: 1775, down 1.7% on week, up 24.5% on year
  • NASDAQ: 4001, down 1.5% on week, up 32.5% on year
  • 10-Year Treasury yield: 2.87% (from 2.88% a week ago)
  • Nov Crude Oil: $96.60, down 1.1% on week
  • Feb Gold: $1234.60, up 0.4% on week
  • AAA Nat'l average price for gallon of regular Gas: $3.24

THE WEEK AHEAD:

Mon 12/16:

8:30 Q3 Productivity

8:30 Empire State Manufacturing Index

9:15 Industrial Production

Tues 12/17:

FOMC begins

8:30 CPI

10:00 Housing Market Index

Weds 12/18:

8:30 Housing Starts

2:00 FOMC Policy Announcement & economic projections

2:30 Bernanke Press Conference

Thurs 12/19:

8:30 Weekly Jobless Claims

10:00 Existing Home Sales

10:00 Philadelphia Fed

Fri 12/20:

8:30 Q3 GDP – final reading (2nd estimate=3.6%)

8:30 Corporate Profits

Week Ahead: Strong Jobs Report leaves Fed in a Pickle

6030885000_572cf278db.jpg

The stronger than expected jobs report leaves the Fed in a pickle. The economy added 203,000 jobs in November and the unemployment rate decreased to a five-year low of 7 percent from 7.3 percent. You may recall that soon-to-be-departed Fed Chairman Ben Bernanke said that when the data indicated that the economy in general – and the labor specifically – was showing progress, the Fed would take its pedal off the gas and reduce its monthly bond purchases, known as Quantitative Easing or “QE3”. The Fed launched QE3 in September 2012. Since then, the unemployment rate has dropped from 8.1 percent to 7 percent and the economy has added over 2.8 million jobs, or an average of nearly 190,000 per month. That sounds pretty good, except when you consider that it’s only about 10,000 per month more than before the introduction of the program.

Still, there is evidence that the pace of job creation is picking up. Over the past four months, the average monthly gain has been over 200,000 after a late spring/summer slow down. Additionally, the November jobs report showed broad-based gains in a variety of sectors, with manufacturing, construction, education, health and retail all demonstrating improvement. Independent research firm Capital Economics believes that the Fed has “all the evidence it needs to begin tapering its asset purchases at the next FOMC meeting later this month.”

Not so fast, says Jon Hilsenrath in the Wall Street Journal. He notes that the drop in rate was driven by a reversal of some of the shutdown-related increase the month before. “A meager 83,000 people became employed between September and November, while the number not in the labor force during that stretch rose by 664,000. The jobless rate fell…because people stopped looking for jobs and removed themselves from the ranks of people counted as unemployed.”

Indeed, the labor force participation rate (the number of people employed or actively seeking a job) remains at near 36-year lows. Oh, and there are still 10.9 million Americans are out of work, of which more than 4 million have been unemployed for more than six months; total payroll employment (136.8 million) is still short of the January 2008 peak of 138.1 million workers; and while an unemployment rate of 7 percent seems good compared to the recession high of 10 percent, it seems miles away from the 4.7 percent rate seen six years ago in November 2007, the month before the recession officially started.

In other words, if the Fed wants to punt on unwinding QE3 at the December 17-18 policy meeting, it could easily find a way to do so. With unemployment still a good distance above the Fed’s 6.5 percent threshold, it is unlikely to raise short-term interest rates until next year.

Volcker Rule: On Tuesday, regulators are expected to approve the "Volcker Rule," named after former Fed Chairman Paul Volcker. The rule is one of the most controversial parts of the 2010 Dodd-Frank financial overhaul because it seeks to stop banks with federally insured deposits from making trades and putting their own capital at risk, in pursuit of speculative trading profits. But as noted in the Financial Times, “after three years of lobbying, wrangling and debating over the rule, there is the potential for a depressingly messy execution…The desire for a rule specific enough to turn grey into black and white risks turning Volcker into a 1,000-page horror.”

MARKETS: Good news was finally good news on Friday, which saved stock investors from steeper losses. Still, it was the first losing weekly decline in nine weeks for the Dow and S&P 500. According to John Linehan, Head of U.S. Equity at T. Rowe Price, this bull market has lasted for 57 months so far, which is the average length of bull markets since 1930.

  • DJIA: 16,020, down 0.4% on week, up 22.2% on year
  • S&P 500: 1805, down 0.04% on week, up 26.5% on year
  • NASDAQ: 4,062, up 0.06% on week, up 34.5% on year
  • 10-Year Treasury yield: 2.88% (from 2.75% a week ago)
  • Jan Crude Oil: $97.65, up 5.3% on week
  • Feb Gold: $1229, down 1.6% on week (5-month low)
  • AAA Nat'l average price for gallon of regular Gas: $3.26

THE WEEK AHEAD:

Mon 12/9:

Tues 12/10:

7:30 NFIB Small Bus Confidence

10:00 Job Openings and Labor Turnover (JOLTS)

10:00 Wholesale Trade

Volcker Rule vote

Weds 12/11:

Thurs 12/12:

8:30 Jobless Claims

8:30 Nov Retail Sales

10:00 Business Inventories

Fri 12/13

8:30 PPI

Week ahead: Congress is the biggest risk to economy

5953182596_be7bcfce5a.jpg

It sure would have been great to hear Federal Reserve Chairman Ben Bernanke start his press conference like this: “Sorry to psych you out, but Congress is the biggest risk to the U.S. economy, so we have to keep buying $85 billion worth of bonds each month.” Instead, Bernanke’s defense of the Fed’s monthly bond-buying program, fondly known as Quantitative Easing or “QE3,” included a three-pronged rationale: (1) the labor market remains weak (2) the recent rise in interest rates could slow down the economy and (3) lawmakers in DC could throw everything for a loop if the government were to shut down or if the nation hits the debt ceiling in October.

Before diving into the three Fed concerns, let’s reflect on how Bernanke amped up investors’ anxieties with “taper talk”. During Congressional testimony on May 22, Bernanke discussed reducing bond purchases, saying "If we see continued improvement and we have confidence that that's going to be sustained then we could in the next few meetings ... take a step down in our pace of purchases. If we do that it would not mean that we are automatically aiming towards a complete wind down. Rather we would be looking beyond that to see how the economy evolves and we could either raise or lower our pace of purchases going forward."

Bottom line: if the economy were to improve, the Fed would pull back on its stimulus. After the June FOMC meeting, Bernanke offered more specific parameters that would argue for a change in bond buying: when the national unemployment rate drops to 7 percent, it would indicate that the economy would have improved “substantially”, and that it would be appropriate to begin tapering within the next few meetings.

OK, so now into the Fed’s three worries.

1. The labor market remains weak. Despite dropping to 7.3 percent (from 8.1 percent when the Fed launched QE3), Bernanke is not convinced that all is rosy on the employment front. Maybe officials were spooked by the last three reports, which indicated that job creation slowed to 149,000 on average, from 172,000 in the previous three months or that long-term unemployment and broader unemployment remains too high.

2. The recent rise in interest rates could slow down the economy. There was some irony in Bernanke using rising interest rates as a reason to maintain bond buying: rates skyrocketed because HE started talking about pulling back on the program! But maybe rates rose higher and faster than the Fed had anticipated. Regardless, Bernanke is worried that higher interest rates “could slow the pace of improvement in the economy and labor market”. There was one other troubling issue with regard to interest rates: the biggest jump in rates occurred between June and July, but there was nary a mention of higher rates posing downside risk in the Fed’s statement from the July 30-31 meeting.

3. Lawmakers in DC could throw everything for a loop. Fiscal uncertainty appears to be the largest unknown that the central bank faces and what was likely the most important reason for holding firm on current policy. Although the Autumnal Equinox will have passed, the heat index is likely to soar in Washington DC next week, as lawmakers duke it out over two fiscal issues: the funding of the government and the debt ceiling. House GOP leaders led a successful effort to pass a bill (230-189) that keeps the government open for business, but eliminates funding of the Affordable Care Act. This week, the Senate is expected to restore ACA funding and then send a stand-alone continuing resolution to fund the government back to the House.

You can see how quickly this could get ugly and might lead to a partial government shutdown on October 1, the start of a new budget year. On top of the pesky issue of funding the government, the nation will likely reach the debt ceiling limit of $16.7 trillion in mid October.

The Fed likely learned a painful lesson from the summer 2011 debt ceiling showdown. The central bank had just concluded its second round of bond buying in June 2011 (the $600B QE2 started in August 2010) so there were no active policies in place when Congress went at it in August 2011. In the aftermath of the debt ceiling smack down, S&P lowered the US credit rating by a notch; economic growth was nearly halved, falling from 2.5 percent in Q2 to 1.3 percent in Q3; the stock market tumbled by 17 percent; and the Fed reacted by introducing “Operation Twist,” in an effort to keep longer-term interest rates low and to spur economic activity.

Sure, the labor market is a bit wobbly of late, but Bernanke himself noted some positive undercurrents, like an increase in hours worked and a drop in weekly claims; and yes, higher mortgage rates could slow the housing recovery. But most housing experts note that the recovery should remain in tact, thought the pace of price gains are likely to moderate.

Bernanke couldn’t say it, so I will: Congress is the biggest near-term risk to the U.S. economy.

MARKETS: One thing Bernanke did not mention during his presser: the biggest beneficiary of bond buying has been the stock market. The S&P 500 is up 19 percent since the launch of QE3 last year. While stocks soared after the FOMC announcement, investors reversed course at the end of the week. Still, it was another winning week on Wall Street.

  • DJIA: 15,541 up 0.5% on week, up 17.9% on year
  • S&P 500: 1709, up 1.3% on week, up 19.9% on year
  • NASDAQ: 3774, up 1.4% on week, up 25% on year
  • 10-Year Treasury yield: 2.74% (from 2.89% a week ago)
  • Nov Crude Oil: $104.75, down 3.3% on week
  • Dec Gold: $1332.50, up 1.8% on week
  • AAA Nat'l average price for gallon of regular Gas: $3.49

THE WEEK AHEAD: The effects of higher mortgage rates on the housing market may not be noticeable yet. Prices are expected to rise, though at a slower pace and activity may perk up, as would-be buyers try to close deals before rates climb even further.

Mon 9/23:

8:30 Chicago Fed Nat’l Activity Index

Tues 9/24:

9:00 FHFA House Price Index

9:00 S&P Case-Shiller HPI

10:00 Consumer Confidence

10:00 Richmond Fed Manufacturing

Weds 9/25:

8:30 Durable Goods Orders

10:00 New Home Sales

Thurs 9/26:

8:30 Weekly Jobless Claims

8:30 Q2 GDP (Final estimate; previous = 2.5%)

8:30 Corporate Profits

10:00 Pending Home Sales

Fri 9/27:

8:30 Personal Income and Spending

9:55 Consumer Sentiment

Week ahead: Financial Crisis Anniversary: Where We Stand

2917292824_caccb179ce.jpg

Over the course of one week five years ago, the U.S. financial system was brought to its knees. As a reminder of just how bad that week was, consider this timeline:

  • 9/15/2008: Lehman Brothers Holdings filed for Chapter 11 bankruptcy protection. On the same day, Bank of America announced its intent to purchase Merrill Lynch for $50 billion.
  • 9/16/2008: The Federal Reserve Board authorized the Federal Reserve Bank of New York to lend up to $85 billion to AIG under Section 13(3) of the Federal Reserve Act.
  • 9/16/2008: The net asset value of shares in the Reserve Primary Money Fund fell below $1 per share, primarily due to losses on Lehman Brothers commercial paper and medium-term notes. When the Reserve fund “broke the buck,” it caused panic among investors who considered money market accounts nearly the equivalent of bank savings accounts.
  • 9/19/2008: To guard against a run on money market funds, the Treasury Department announced that it would insure up to $50 billion in money-market fund investments at companies that paid a fee to participate in the program. The year long initiative guaranteed that the funds' values would not fall below the $1 a share.
  • 9/20/2008: The Treasury Department submitted draft legislation to Congress for authority to purchase troubled assets (the first version of TARP).
  • 9/21/2008: The Federal Reserve Board approved applications of investment banking companies Goldman Sachs and Morgan Stanley to become bank holding companies.

Over the course of one week, four investment banks were gone (one absorbed, one went broke and two were forced to become bank holding companies); a global insurance company was bailed out; the money market fund industry was rocked; and the Treasury Department introduced the first version of TARP, which granted authority to purchase $700 billion of mortgage-related assets for two years.

Where do we stand five years after this momentous week?

Jobs: In September 2008, the unemployment rate was 6.1 percent, on its way up to 10 percent in October 2009. The rate now stands at 7.3 percent. Despite progress during the recovery, the economy still has 1.9 million fewer jobs than it did before the recession. At the recent pace of job growth it will take just under 11 months to reach the previous peak.

Income: For those lucky enough to have jobs, the financial crisis and recession put a dent in median household income. According to Sentier Research, July 2013 median household income ($52,113), adjusted for inflation, was 6.2 percent lower than December 2007 ($55,569), the first month of the recession. Incomes are 5 percent lower than in September 2008. It may be cold comfort to consider that the recession exacerbated a trend that was already occurring: July 2013 median was 7.3 percent lower than the median in January 2000 ($56,233), the beginning of the statistical series.

Economic growth: In the fourth quarter of 2008, when the impact of the financial crisis was cascading through the system, Gross Domestic Product dropped by 8.3 percent. For all of 2008, GDP slid 0.3 percent, followed by a 2.8 percent drop in 2009. The official end of the recession (as determined by the Dating Committee of the National Bureau of Economic Research) occurred in June 2009. While the total size of the US economy today ($15,681T) is larger than it was in Q3 2008 ($14.895T), the pace of the recovery has lagged the annual average post World War II growth rate of 3-3.5 percent.

Stocks: At the end of trading that first fateful week of the financial crisis, the damage wasn’t so bad, if you didn't have to live through the day-to-day swings. By Friday September 19, 2008 the Dow had dropped just 33 points to 11,388; the S&P 500 edged up 4 points to 1,255; and the NASDAQ was up 12 points to 2,273. Stocks bottomed out in March 2009 and then skyrocketed by nearly 150 percent to today’s near-record levels.

Housing: While stock markets bottomed out about six months after the Lehman Brothers bankruptcy, it took the epicenter of the crisis, the housing market, far longer. House prices peaked in 2006, then reached bottom in early 2012. National house prices are up nearly 16 percent from the post-bubble low, but still remain down over 23 percent from the peak. Currently, 14.5 percent of residential properties with a mortgage are still underwater (amount owed on mortgage is more than the home’s value), according to CoreLogic. The rate was down from the peak of 26 percent in the fourth quarter of 2009.

Bailouts: The government used extraordinary measures to save the financial system, including directly bailing out the financial and automobile industries. Of course, there were plenty of other measures that indirectly helped, liked providing financing through the Federal Reserve’s discount window for US banks, European banks and even for industrial conglomerates like General Electric. Here’s the accounting for some bailouts of note:

  • Fannie Mae/Freddie Mac: $188B bailout, of which the companies are expected to return $146B in dividends by Sep 2013.
  • GM and Chrysler: Of $80B committed, $51B repaid
  • TARP: Of $700B, most has been repaid with interest. CBO puts eventual taxpayer tab at $21B.
  • AIG: Fed and Treasury committed $182B, with taxpayers estimated to be fully repaid, plus $23B.

Regulatory: The Dodd-Frank Wall Street Reform and Consumer Protection Act was enacted in July 2010, but lawmakers left a lot of the hard work to regulators. According to law firm Davis Polk, as of September 3, 2013, a total of 280 Dodd-Frank rulemaking requirement deadlines have passed. Of these 280 passed deadlines, 172 (61.4 percent) have been missed and 108 (38.6 percent) have been met with finalized rules. In addition, 160 (40.2 percent) of the 398 total required rulemakings have been finalized, while 126 (31.7 percent) rulemaking requirements have not yet been proposed.

Too Big To Fail: There may be fewer banks, but they are even bigger than they were at the beginning of 2007. The combined assets of the “Big Six,” which include JP Morgan Chase, Bank of America, Citigroup, Wells Fargo, Goldman Sachs and Morgan Stanley, have increased by 28 percent, according to data compiled by Bloomberg. The good news is that they have much more capital on hand. The bad news is that they are still leveraged, complicated and interconnected institutions, which makes them prone to inflict damage on the overall financial system.

Who paid what? There have been billions of dollars worth of penalties, which were levied as a result of the financial crisis. Among the biggies, the SEC has collected $2.73B and the national mortgage settlement will rake in $25B from the nation’s five largest mortgage servicers.

Who went to jail? Nobody. Jail is for federal crimes and there have been no federal convictions that have arisen from the financial crisis. (Fraudsters like Bernie Madoff and Alan Stanford didn’t have a direct connection with the financial crisis.) On the civil side, the SEC has filed civil charges against 138 firms and individuals for alleged misconduct just before or during the crisis, according to The Wall Street Journal. The biggest fish the regulators tried to land was former Countrywide CEO Angelo Mozillo, who ultimately settled with the SEC to the tune of $67.5 million in fines and a lifetime ban from serving as an officer of a public company. Former Goldman Sachs employee Fabrice “Fabulous Fab” Tourre was found guilty of misleading investors in mortgage securities issued by his firm.

Bottom Line: Just in time for the five-year anniversary, the Federal Reserve Bank of Dallas released a bleak assessment of the cost of the crisis. “Our bottom-line estimate of, assuming output eventually returns to its pre-crisis trend path, is an output loss of $6 trillion to $14 trillion. This amounts to $50,000 to $120,000 for every U.S. household…This seemingly wide range of estimates is due in part to the uncertainty of how long it might take to return to the pre-crisis growth trend.”

But, wait it gets worse. The Fed economists note that the U.S. may never return to trend, which would put the cost ABOVE $14 trillion. HAPPY ANNIVERSARY!

MARKETS:

  • DJIA: 15,376 up 3% on week, up 17.3% on year (2nd best week of the year)
  • S&P 500: 1688, up 2% on week, up 18.4% on year (within 1.3% of its Aug. 2 all-time nominal high)
  • NASDAQ: 3722, up 1.7% on week, up 23.3% on year
  • 10-Year Treasury yield: 2.89% (from 2.94% a week ago)
  • Oct Crude Oil: $108.21, down 2% on week
  • Dec Gold: $1308.60, down 5.6% on week
  • AAA Nat'l average price for gallon of regular Gas: $3.54

THE WEEK AHEAD: Here comes the Fed…the central bank will conduct a two-day confab, where most economists expect an announcement of a small pull back in monthly bond purchases (from $85B to $75B). Let the taper begin!

Mon 9/16:

8:30 Empire State Manufacturing

9:15 Industrial Production

Tues 9/17:

FOMC Begins

8:30 CPI

10:00 Housing Market Index

Weds 9/18:

2:00 FOMC Announcement/FOMC Forecasts

2:30 Bernanke Press Conference

Thurs 9/19:

8:30 Weekly Jobless Claims

10:00 Existing Home Sales

10:00 Philadelphia Fed

Fri 9/20:

Quadruple Witching: The expiration of stock index futures, stock index options, stock options and single stock futures…can lead to increased volatility.

New iPhones in stores

Week ahead: Jobs report and the Fed's nice mess

1535543995_7b075dbf12.jpg

Well, here's another nice mess you've gotten me into!” – Oliver Hardy For a couple of weeks, it was looking like the Fed’s plan to reduce the stimulus it was pumping into the economy (QE3 or the $85 billion of monthly bond purchases) was a done deal. The recent data looked good: second quarter growth was revised higher to a 2.5 percent annualized rate; the monthly average of weekly jobless claims fell to the lowest level since the recession began at the end of 2007; the Institute for Supply Management's manufacturing and service sector indexes improved during the summer; and car sales were strong.

Then the Labor Department released the August jobs report. At first glance it didn’t seem so bad: 169,000 non-farm jobs added, just a bit shy of the 180,000 expected; and the unemployment rate ticked down to 7.3 percent from 7.4 percent, a level last seen at the end of 2008.

But peeling back the onion, things didn’t look too good. The previous two months were revised lower by 74,000, bringing the 2013 average monthly job creation down to 180,000 jobs a month, only slightly ahead of the 175,000 monthly pace seen over the past two years. And then there’s the rate, which dropped for the worst of all reasons: more than 300,000 people left the labor force.

The participation rate, which is the percentage of working age population that is active (employed or seeking employment) in the labor force, fell to a 35-year low of 63.2 percent. To put that number in perspective, the participation rate was 66 – 67 percent over the last 20 years, although some part of the recent decline is due to demographics (i.e. baby boomers retiring). According to Bill McBride of Calculated Risk, “if the participation rate had held steady, the unemployment rate would have increased to 7.5 percent instead of declining to 7.3 percent.”

After parsing the jobs report, the Fed’s decision to taper may not look like a lay up. At the June FOMC press conference, Bernanke said that the Fed would “moderate the monthly pace of purchases later this year” if the data were to be consistent with the Fed’s prediction of slow economic progress. With the August report and revisions to the past two months, there is a case to be made that the improvement is too slow to warrant any change to current policy. After all, the six-month average of job creation is 160,000, which is not much higher than where it stood a year ago, when the Fed believed it was necessary to launch QE3.

But the aforementioned other data points, along with the fact that total non-farm employment has increased by 2.2 million from a year ago and the rate has dropped from 8.1 percent in August 2012 to 7.3 percent currently, might be enough to convince Fed officials that the time has come to at least begin the process of unwinding their aggressive monetary policy. Even after the tepid jobs report, most analysts believe the central bank will announce that it will reduce monthly bond purchases by $10 to $15 billion at the September meeting.

MARKETS: The Dow snapped a four-week losing streak, but it certainly didn’t feel that good. Still, U.S. stocks remain solidly higher on the year...if only we could stop trading now!

  • DJIA: 14,922 up 0.7% on week, up 13.9% on year
  • S&P 500: 1655, up 1.4% on week, up 16% on year
  • NASDAQ: 3660, up 1.9% on week, up 21.2% on year
  • 10-Year Treasury yield: 2.94% (from 2.75% a week ago, broke above 3% on Friday; first time since July 2011)
  • Oct Crude Oil: $110.53, up 2.7% on week (a 28-month high)
  • Dec Gold: $1386.50, down 0.7% on week
  • AAA Nat'l average price for gallon of regular Gas: $3.58

THE WEEK AHEAD: Congress is back in session this week and while the focus is likely to be Syria, expect to start hearing about the debt ceiling. The government is on course to reach its $16.7 trillion borrowing limit in mid-October. On the economic calendar, the highlight will be retail sales, which are expected to show a month over month increase of 0.5 percent. If so, the report would provide further confirmation that the economy is gaining steam headed into the final four months of the year.

Mon 9/9:

Congress returns

3:00 Consumer Credit

Tues 9/10:

7:30 NFIB small-business optimism index

1:00 Apple unveils the iPhone5S

Weds 9/11:

10:00 Wholesale Trade

Thurs 9/12:

8:30 Weekly Jobless Claims

8:30 Import/Export Prices

2:00 Federal Budget

Fri 9/13:

8:30 Retail Sales

8:30 Producer Price Index

Week ahead: September will be bumpy for investors

4968604816_b48b0d82a5.jpg

I hope you rested up over the long weekend, because September will be a busy and volatile month. Here are the issues that will shape the action in the month ahead. Syria: Global investors fear that U.S. military action in Syria might spur a wider regional conflict, which could disrupt the flow of oil in the Middle East. There were already concerns that the Egyptian conflict would affect 4.5 million barrels a day of petroleum products that flow through the Suez and SUMED Pipeline. But if tensions were to spread to the Straight of Hormuz, where 17 million barrels a day flow, oil and gas prices would jump and global economic growth would be hindered.

Jobs Report: The last major economic release before the Federal Reserve’s September policy meeting will be this week’s non-farm payroll employment report. In August, the four-week average of initial jobless claims fell to a six-year low of 330,000. While job cuts are tapering off, what is less clear is whether employers are ready to start hiring on a broad based and consistent enough level to bring down the unemployment rate and to help some of the 11.5 million unemployed Americans to land jobs. The consensus for August is for a monthly increase of 180,000, which would be a small increase from July’s 162,000. The unemployment rate is expected to remain at 7.4 percent.

Federal Reserve Policy Change: After last week’s upward revision to second-quarter GDP growth to a 2.5 percent annualized rate from the originally reported 1.7 percent, more analysts believe that the Federal Reserve will begin to taper its monthly bond purchases at the upcoming September 17-18 FOMC policy meeting. Doubters note that the uncertainty surrounding Syria, the recent rise in oil prices, weakness in consumer spending, and a slow down in the housing recovery might prompt the Fed to wait until the December meeting. Investors have been preparing for the taper since late May, but the scale of the reduction remains the big mystery.

Debt Ceiling, Part Deux:  It was just over two years ago when Congress fought about increasing the nation’s borrowing limit. After that battle, Standard & Poor’s downgraded the U.S.’ credit rating and the S&P 500 stock index subsequently dropped by more than 17 percent. Last week, Treasury Secretary Jack Lew sent a letter to Speaker John Boehner indicating that the government would effectively reach its $16.7 trillion debt ceiling in mid-October. Both sides have drawn their respective lines in the sand, which means that the fiscal battle in Washington could get ugly and spread to Wall Street in a hurry.

September is the cruelest month for stocks: While stock markets tend to crash in October, September has actually been the worst month for stock performance, according to the Stock Trader's Almanac, with the S&P 500 losing an average of 0.52 percent since 1971.

MARKETS: US stock indexes closed down on the month, with the Dow and S&P 500 seeing their worst months since May 2012.

  • DJIA: 14810, down 1.3% on week, down 4.4% on month, up 13% on year
  • S&P 500: 1633, down 1.8% on week, down 3.1% on month, up 14.5% on year
  • NASDAQ: 36589, down 1.9% on week, down 1% on month, up 18.9% on year
  • 10-Year Treasury yield: 2.75% (from 2.82% a week ago) 4th consecutive month of price declines/yield increases
  • Oct Crude Oil: $107.65, up 1.1% on week
  • Dec Gold: $1396.10, up 0.08% on week
  • AAA Nat'l average price for gallon of regular Gas: $3.59

THE WEEK AHEAD:

Mon 9/2: US MARKETS CLOSED FOR LABOR DAY

Tues 9/3:

10:00 ISM Mfg Index

10:00 Construction Spending

Weds 9/3:

Motor Vehicle Sales

8:30 International Trade

2:00 Fed Beige Book

Thurs 9/4:

7:30 Challenger Job-Cut Report

8:15 ADP Employment Report

8:30 Weekly Jobless Claims

8:30 Productivity and Costs

10:00 Factory Orders

10:00 ISM Non-Mfg Index

Fri 9/5:

8:30 August Employment Report