Correction

Rooting for a Stock Market Correction

Rooting for a Stock Market Correction

There have been four stock market corrections (a decline of 10 percent or more from the recent high) during the current eight-year long bull market. According to research dating back to 1900, corrections have occurred about once a year on average, and lasted on average about 115 days. Over the past thirty years or so, the S&P 500 has seen 21 corrections. Talk is increasing that correction number five of the second longest bull market on record, is just around the corner. If you are a long-term investor, you should be rooting for a correction. After all, wouldn’t you rather buy stocks at a 10 percent discount to where they are today?

September Stock Selloff?

3161095736_042f71a9d7_z.jpg

2016 started with a stock sell off and full-blown correction (down 10 percent from the recent peak), challenging investors to remain calm and stick to their game plans. Then Brexit came along and once again, rattled nerves. Today the Cassandra's are out again with an old worry: the Fed will kill the stock market rally. The reignited jitters have been attributed to a few central bank officials hinting that the improving economy may justify an interest rate increase as soon as next week’s Fed meeting. Previously, there seemed to be little doubt that the central bank would wait at least until the December meeting. While most believe that December is still more likely, the selling acknowledges that the most recent leg up in stock prices occurred NOT because the economy is humming and companies are making a lot of money; rather the buying has been a sign that big investors feel with interest rates so low, stocks are the only assets that can deliver any potential for gains. As Federal Reserve  Governor Daniel Tarullo recently acknowledged “There's no question...when rates are low for a long time that there are opportunities for frothiness and perhaps over-leverage in particular asset markets.” (Emphasis added!)

In other words, when rates stay so low for so long, investors look past fundamentals, drive prices higher and can become complacent. One sign of that complacency can be seen in the VIX index, which is a measure of the expected swings in the S&P 500 over the next thirty days. Recently, the 30 day annualized volatility (of daily changes) in the S&P 500 fell to its lowest level since 1994. Friday’s selling may simply be proof that people periodically remember that the risks they previously accepted, may no longer feel so great, especially considering the age of the bull market. But as the analysts at Capital Economics note, “The fact that volatility was low in the mid-1990s did not preclude equity prices from rising for several years as a bubble inflated.”

Still, when you hear dire predictions, it’s hard not to feel butterflies. Although some investors may be tempted to sell, they do so at their own peril. Market timing requires you to make two precise decisions: when to sell and then when to buy back in, something that is nearly impossible. After all, even if you sell and manage to steer clear of the bear by staying in cash, you will not be able to reinvest dividends and fixed-income payments at the bottom and you are likely to miss the eventual market recovery. The best way to avoid falling into the trap of letting your emotions dictate your investment decisions is to remember that you are a long-term investor and you do not have all of your eggs in one basket. Try to adhere to a diversified portfolio strategy, based on your goals, risk tolerance and time horizon and do not be reactive to short-term market conditions, because over the long term, this strategy works. It’s not easy to do, but sometimes the best action is NO ACTION.

If you are really freaked out about the movement in your portfolio, perhaps you came into this period with too much risk. If that’s the case, you may need to trim readjust your allocation. If you do make changes, be careful NOT to jump back into those riskier holdings after markets stabilize.


What Does Brexit Mean for MY Money?

27279158203_4c8311e4b8_z.jpg

Since voters in the United Kingdom decided to leave the European Union last week, US consumers, investors and even travelers are trying to understand the impact of the historic Brexit vote. The question I continue to field is" “What does Brexit mean for MY money?”  Unlike the run of the mill correction that we saw earlier this year, the UK’s exit from the 28-member union is an “exogenous event.” That means that it has come from outside the predicted modeling system that most economists utilize and as a result, can have significant, negative effects on prices. For example, the British pound sterling tumbled to its lowest level against the US dollar in thirty years and global stocks have fallen sharply. Meanwhile, bastions of safety like US treasuries, German bunds and gold are rising. Still, large financial firms are saying that so far, there is no liquidity crisis and markets are functioning well.

While that is indeed good news, let’s not repeat old mistakes. Consider this: nine years ago this month, June, 2007, an unexpected event occurred: investment banking firm Bear Sterns (BS) had to bail out two of its hedge funds that were collapsing because of bad bets on subprime mortgages. At the time, there was no mystery surrounding the risks that were emerging, though 15 months later, there were complaints that the financial media had failed to sound the warning alarms.

In fact, the New York Times said the crisis at BS stemmed “directly from the slumping housing market and the fallout from loose lending practices that showered money on people with weak, or subprime, credit, leaving many of them struggling to stay in their homes. Bear Sterns averted a meltdown this time, but if delinquencies and defaults on subprime loans surge, Wall Street firms, hedge funds and pension funds could be left holding billions of dollars in bonds and securities backed by loans that are quickly losing their value.”

Let’s put that seemingly small BS event from nine years ago into context:

  • June 2007: BS Bails out funds
  • October 2007: US stock indexes hit all-time highs
  • March 2008: BS goes broke and is taken over by JP Morgan Chase
  • September 2008: Lehman Brothers Holdings files for Chapter 11 bankruptcy protection; Bank of America purchases Merrill Lynch; the Federal Reserve Bank of New York is authorized to lend up to $85 billion to AIG; the Reserve Primary Money Fund falls below $1 per share; Goldman Sachs and Morgan Stanley become bank holding companies

I am not suggesting that Brexit will cause a financial crisis, but we should carefully consider what dangerous spillover effects could occur. While US banks are better capitalized than they were leading up to the fall of 2008, the UK and European banks do not look nearly as healthy. In the two trading sessions after Brexit, the European Bank index lost about a quarter of its value and UK based banks did even worse.

If you are traveling to the UK or Europe or you enjoy imported cheese and wine, you might be delighted to see the US dollar strengthen. But as the dollar rises, emerging markets like China could come under pressure, echoing what happened in the first six weeks of the year, when global stocks tumbled and US stock corrected. And if European growth slows, its weaker economies (Portugal, Italy, Greece, Spain) will once again be at the heart of sovereign debt questions.

In terms of the US, analysts at Capital Economics say the UK and the EU account for 4 and 15 percent of US exports, respectively. If both regions go into a recession, Brexit could shave 0.2-0.3 percent from the current US growth rate of 2 percent. But estimates can be rocked by emotions. A US-based multinational may hold back on hiring everywhere to see how things shake out post-Brexit. For US exporters, the rising US dollar will create a drag on competitiveness in overseas markets and could potentially trigger lay offs at home. And if non-affected businesses and consumers start to feel unnerved, they too might pull in the reins, causing the US economy to slow down more than anticipated.

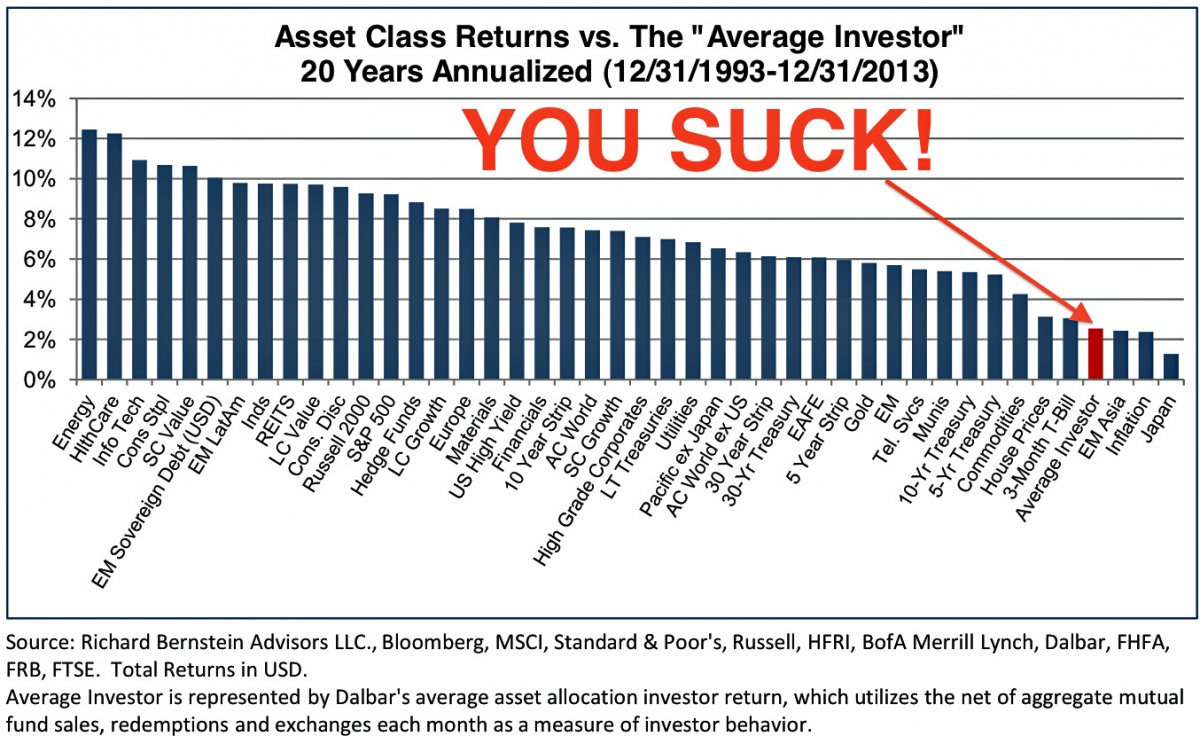
Amid all of this uncertainty, anxiety levels are rising, testing the third longest bull market in history. Some may feel butterflies and may even be tempted to sell. Remember that market timing rarely works because even if you sell and manage to steer clear of the bear by staying in cash, you will not be able to reinvest dividends and fixed-income payments at the bottom and you are likely to miss the eventual market recovery. There is clear evidence that when investors react either to the upside or downside, they generally make the wrong decision.

The best way to avoid falling into the trap of letting your emotions dictate your investment decisions is to remember that you are a long-term investor and do not have all of your eggs in one basket. Your diversified portfolio strategy, based on your goals, risk tolerance and time horizon should help you fight the urge to react to short-term market conditions. It’s not easy to do, but sometimes the best action is NO ACTION. And don’t forget that if you are still contributing to your retirement plan or funding your kid’s education fund, take comfort in knowing that you are buying shares at cheaper prices.

If you are really freaked out about the movement in your portfolio, perhaps you came into this period with too much risk. If that’s the case, you may need to trim readjust your allocation. If you do make changes, be careful NOT to jump back into those riskier holdings after markets stabilize. Finally, if you need access to your money in the short-term (within the next 6-12 months), be sure that it is not invested in an asset that can fluctuate.

Investing Amid Market Volatility

3161095736_042f71a9d7_z.jpg

It has been a rough year for investors. U..S stock indexes have plunged into correction territory (down 10 percent from the recent peak) for the second time in six months and the big swings are testing every investor’s internal fortitude. The bad start to the year is causing a bit of déjà vu all over again, especially given the dire predictions of some economists and analysts. The current situation is not like 2008, primarily because there is no financial crisis brewing. In fact corporate balance sheets (outside of the energy sector), including those of financial services companies, are in decent shape. Additionally, despite slowdown fears, the U.S. economy, while not strong, is still growing by about 2 percent annually. That means in a year like 2015, you have soft quarters like Q1 and Q4 where there is barely any growth (+0.6 percent and estimated +1 percent) and the recession calls are abundant, and stronger ones like Q2 and Q3, where the economy seems fine (+3.9 percent and +2 percent).

Still, when people hear big banks, like RBS saying “The downside is crystallizing. Watch out. Sell (mostly) everything” it’s hard not to feel butterflies. Although some investors may be tempted to sell, they do so at their own peril. Market timing requires you to make two precise decisions: when to sell and then when to buy back in, something that is nearly impossible. After all, even if you sell and manage to steer clear of the bear by staying in cash, you will not be able to reinvest dividends and fixed-income payments at the bottom and you are likely to miss the eventual market recovery.

In fact, data from Dalbar confirm that when investors react, they generally make the wrong decision, which explains why the average investor has earned half of what they would have earned by buying and holding an S&P index fund. We’ll see if the folks at RBS can beat the odds.

The best way to avoid falling into the trap of letting your emotions dictate your investment decisions is to remember that you are a long-term investor and you do not have all of your eggs in one basket. Try to adhere to a diversified portfolio strategy, based on your goals, risk tolerance and time horizon and do not be reactive to short-term market conditions, because over the long term, this strategy works. It’s not easy to do, but sometimes the best action is NO ACTION.

If you are really freaked out about the movement in your portfolio, perhaps you came into this period with too much risk. If that’s the case, you may need to trim readjust your allocation. If you do make changes, be careful NOT to jump back into those riskier holdings after markets stabilize.

If you have cash that is on the sidelines and are nervous putting it to work as a lump sum, you should take heart in research from Vanguard, which shows that two-thirds of the time, investing a windfall immediately yields better returns than putting smaller, fixed dollars to work at regular intervals.

But, if you are the kind of investor who is less concerned with the probability of earning and more worried about losing a big chunk of money immediately, you may want to stick to dollar cost averaging. Vanguard notes “risk-averse investors may be less concerned about averages than they are about worst-case scenarios, as well as the potential feelings of regret that would occur if a lump-sum investment were made immediately prior to a market decline.”

The Fed Fails to Soothe Investors

21119109388_aedf2c537d.jpg

Citing the slowdown in China and other emerging markets; a strengthening US dollar; global market volatility; and persistently low inflation, the Federal Reserve kept short term interest rates at 0-0.25 percent, which is where they have been for nearly seven years. Although the central bankers believe that these issues are “transitory,” they decided to err on the side of caution and do nothing. If Fed officials meant to soothe investors, they failed, at least in the short term. In the category of unintended consequences, the Fed’s inaction, which was meant to assuage, may have had the opposite effect, by reinforcing investors’ worries about the global economy. Previous fears about China’s growth, which caused the summer stock market correction, went straight to the front burner, despite scant evidence that the global slowdown has hit US shores.

Stocks edged lower the afternoon of the decision and tumbled the following session. Although a rate increase may have done even more damage to stocks, the fact that the Fed did not follow through on a rate increase, after telegraphing it for months, has led some analysts to question they can trust what officials are communicating to the public. Paul Ashworth of Capital Economics wrote “A few months ago it was Greece, now it is China. According to the Fed’s accompanying statement ‘recent global economic and financial developments may restrain economic activity somewhat." [His emphasis] In another couple of months it could be the debt ceiling or who knows what else that is generating the uncertainty.”

While the status of the world’s economy may be uncertain now, one thing is clear: median household income in the US is stuck. With all eyes on the Fed, few paid attention to the mid-week release of a Census Bureau report, which showed that median household income was $53,657 in 2014, an $805 decrease from 2013. This is the third consecutive year that the annual change was not statistically significant, following two consecutive annual declines.

More sobering is that when adjusted for inflation, the median household is 6.5 percent lower than it was in 2007 ($57,357), on the eve of the recession and 7 percent lower than it was 15 years ago in 2000 ($57,724), prior to the previous recession. (Income data from Sentier Research are a bit better, but show a similar trend—the median household income in July was 2.6 percent lower than when the recession started and 3.8 percent below January 2000 levels.)

Median income peaked in the mid-1990’s and since then, has gone nowhere fast. Despite hopes for overall wage gains in the current recovery, most of the progress on incomes has been clustered around the top 5 percent of all earners. The gap between high earners and low earners has increased 5.9 percent from 1993, the earliest year available for comparable measures of income inequality.

I hate to end on such a sour note, so perhaps wages will soon start to show improvement across all income levels. Chairman Janet Yellen said that the pace of job gains has been “solid” and fed officials raised their growth forecasts for this year, so maybe, just maybe, the income numbers will start to pick up. Even if they don’t, a sunnier outlook in the fourth quarter is likely to prompt the Fed to raise rates by a quarter-point, either in October or December. 

MARKETS:

  • DJIA: 16,384 down 0.3% on week, down 8% YTD
  • S&P 500: 1,958 down 0.2% on week, down 4.9% YTD
  • NASDAQ: 4,827 up 0.1% on week, up 2% YTD
  • Russell 2000: 1163, up 0.5% on week, down 3.4% YTD
  • 10-Year Treasury yield: 2.19% (from 2.19% a week ago)
  • October Crude: $44.68, down 0.01% on week
  • December Gold: $1,137.80, up 3.1% on week
  • AAA Nat'l avg. for gallon of reg. gas: $2.30 (from $2.35 wk ago, $3.36 a year ago)

THE WEEK AHEAD:

Mon 9/21:

8:30 Existing Home Sales

Tues 9/22:

Weds 9/23:

Thurs 9/24: 8:30 Durable Goods Orders

10:00 New Home Sales

5:00 Janet Yellen Speaks at UMass/Amherst

Fri 9/25:

8:30 Q2 GDP (final reading)

10:00 Consumer Sentiment

Greece, Jeb! and Stock Corrections

11379254813_847c279e27_z1.jpg

European leaders will convene yet another emergency meeting in Brussels on Monday to discuss how and whether to restructure Greece’s debt. This may all sound like déjà vu all over again, but contrary to five years ago when the Greek drama started to unfold, today investors are less concerned that a default would take down the euro zone or the interconnected global economy. It could however, create a bout of panic in the markets. If officials do not come to an agreement, they will have no choice but to come up with a Plan B, which would likely include capital controls to limit withdrawals from Greek banks and prevent a classic run on the banks (see “It’s a Wonderful Life” for the best explanation of a bank run). In fact, about €5 billion of deposits reportedly left Greek banks last week alone. Instead of a well-orchestrated Grexit, there could be what the FT’s John Authers calls a “Graccident”, where a default would lead to a messy and de facto Grexit. Plan B would also likely include the European Central Bank’s extension of emergency loans to Greek financial institutions and Greece’s preparation of a new currency or IOU system.

As the tragedy that is Greece continues, investors seem more interested in the Federal Reserve. Last week, Chair Janet Yellen elegantly threaded the needle: Yes, the central bank would most likely raise short-term interest rates this year (probably two quarter of a percent increments), but the pace of increases will be gradual. Complicating matters for the central bankers was the first quarter, when the economy contracted by 0.7 percent. Sure, most of the slowdown was due to transitory factors, like weather, the West Coast port shutdown and $40 crude oil, but far be it for this Fed to err on the side of snuffing out potential growth.

The government will provide a third update to Q1 GDP this week, which may show marginal improvement, but most have already set their sights on the rest of the year, which should improve steadily. Because Q1 was such a stinker, growth for the total year is likely to be 2.5 percent, matching the pace of the past few years.

I usually quote the post World War II rate of growth, which is about 3.3 percent, as a benchmark, but according to the New York Times that longer term average may overstate the expected growth rate today. The reason is that “Over the last 40 years, the American economy has grown at an average of 2.8 percent per year,” which is considerably slower than the 3.7 percent average from 1948 to 1975. Additionally, the higher rate includes “two favorable trends that are now over: women entering the work force, and baby boomers reaching their prime earning years.”

The downshift in growth expectations might come as a surprise to newly minted presidential candidate Jeb Bush, who in a speech last week said that his goal for economic growth was 4 percent. The Financial Times called this figure “Fantasyland” and the NYT chimed in, saying Mr. Bush’s 4 percent goal has “close to 0 Percent Chance” at success.

MARKETS: While the NASDAQ and Russell 2000 indexes were making new highs last week, two other indexes weren’t so fortunate. The Dow Jones Transportation Average entered correction territory (a drop of more than 10 percent) for the first time in nearly four years and the Shanghai Composite lost 13.3 percent for the week, the worst week since the financial crisis and the second time this year it has fallen into correction territory. Additionally, last week brought the biggest outflows from bond funds in two years, triggered by the possibility of not one, but two, interest rate hikes later this year. These events were just more fodder for those worried investors who are convinced that the next leg for the broad U.S. market is down.

  • DJIA: 18,015, up 0.7% on week, up 1.1% YTD
  • S&P 500: 2110, up 0.8% on week, up 2.5% YTD
  • NASDAQ: 5,117 up 1.3% on week, up 8% YTD
  • Russell 2000: 1284, up 1.6% on week, up 6.6% YTD
  • 10-Year Treasury yield: 2.27% (from 2.39% a week ago)
  • August Crude: $59.61, down 0.6% on week
  • August Gold: $1201.90, up 1.9% on week
  • AAA Nat'l avg. for gallon of reg. gas: $2.80 (from $2.80 wk ago, $3.68 a year ago)

THE WEEK AHEAD:

Mon 6/22:

8:30 Chicago Fed

10:00 Existing Home Sales

Tues 6/23:

8:30 Durable Goods Orders

9:00 FHFA Home Price Index

10:00 New Home Sales

Weds 6/24:

8:30 Q1 GDP – final reading (prev = -0.7%)

Thurs 6/25:

8:30 Personal Income & Spending

Fri 6/26:

10:00 Consumer Sentiment

Near-Correction to Stock Market Highs: We Still Stink at Investing

8498571169-d975c9bfb1-o.jpg

The WSJ’s Morgan Housel gets the market-timing award of the season. On September 13th, he wrote “With stocks more than doubling in value over the past five years, now is the time to prepare yourself for the emotional roller coaster that will come during the inevitable correction.” (Emphasis mine.) While an official correction of 10 percent did not materialize, on September 19th, just days after Housel's article was published, the S&P 500 hit an all-time high of 2,019 and then began a 9.8 percent plunge to an intra-day low of 1,820 on October 15th. U.S. stock indexes reclaimed new highs on Friday (see the numbers below), rescuing what was shaping up to be an ugly month. Market action in October was a great lesson in a few tried and true investment mantras, like “stick to your game plan”, “being an investor means signing up for ups and downs from time to time” and “don’t let your emotions take over”.

And about those emotions…they really can mess with your investment returns, because so often, they lead you to buy high and sell low, which can cost the average investor about three percentage points a year in lost return over the long run. The proclivity to trade at exactly the wrong time encouraged Business Insider to add “YOU SUCK” to this chart from Richard Bernstein Advisors: (click on the chart to enlarge):

You Suck at Investing

You’ll notice that during this twenty-year period, which includes the dot-com boom and bust, as well as the recent housing and credit boom and bust and the Great Recession, the Average Investor has not done too well. The reason is clear: people jump in and out of markets at the wrong time! The best defense against those emotional decisions is to stick to that diversified portfolio and don’t mess with it when markets move up or down.

Now that we got that out of the way, let’s return to a fundamental question: How is the economy doing? The first reading of third quarter US growth came in at a better than expected 3.5 percent annual pace, boosted by a 7.8 percent surge in exports and a 10 percent jump in federal spending. That’s the good news. The not-so-good news is that consumer spending, which accounts for about two-thirds of the economy, slowed to a 1.8 percent annual pace from 2.5 percent in the second quarter. As we enter the all-important holiday season, economists are eager to see whether consumers become a tad less parsimonious and open those physical and electronic wallets to spend more freely.

One reason consumers may not have been as willing to spend is that wage growth has only increased at about the pace of inflation. There will be more information about that when the October jobs report is released on Friday. Economists predict that employers added 225,000 jobs and the unemployment rate remained at 5.9 percent, the lowest level since July 2008. If the numbers improve dramatically, it could actually have a negative impact on stocks, as investors may surmise that the Federal Reserve might consider raising short-term interest rates sooner than expected…higher interest rates are seen as a headwind for the stock market.

Reports on manufacturing, as well as factory orders and vehicle sales could tell us whether the combination of a global slowdown and a stronger US dollar is starting to negatively impact US exporters. Last year, manufacturers contributed just over $2 trillion to the economy, which represents 12.5 percent of GDP. But economists focus on the sector because for every $1.00 spent in manufacturing, another $1.32 is added to the economy, the highest multiplier effect of any economic sector.

MARKETS: Just in time for the holiday season and for the first time in four years, prices at the pump for regular gas have dropped to under $3/gallon nationally. Consumers are saving about $250 million a day on gasoline compared with early summer, when the national average hit $3.68 a gallon, according to AAA.

  • DJIA: 17,390 up 3.5% on week, up 2% on month, up 4.9% YTD (best percentage weekly gain since Jan 2013)
  • S&P 500: 2018, up 2.7% on week, up 2.3% on month, up 9.2% YTD (best two-week gain since Dec 2011)
  • NASDAQ: 4630, up 3.3% on week, up 3% on month, up 10.9% YTD (highest level since Mar 2000)
  • Russell 2000: 1173, up 4.9% on week, up 6.5% on month, up 0.8% YTD
  • 10-Year Treasury yield: 2.34% (from 2.27% a week ago)
  • December Crude Oil: $80.54, down 0.6% on the week, down 12% on month (down 25% from June highs)
  • December Gold: $1171.60, down 4.9% on the week, down 3.3% on month, down 2.6% YTD (lowest level since Jul 2010)
  • AAA Nat'l average price for gallon of regular Gas: $2.99 (from $3.30 a year ago, down 33 cents in October, lowest level since Dec 2010)

THE WEEK AHEAD:

Mon 11/3:

Automobile Sales

9:45 PMI Manufacturing

10:00 ISM Manufacturing

10:00 Construction Spending

Tues 11/4:

8:30 International Trade

10:00 Factory Orders

Weds 11/5:

CBS, NewsCorp, Whole Foods

8:15 ADP Private Payroll Report

10:00 ISM Non-Manufacturing

Thurs 11/6:

AOL, Walt Disney, Zynga

8:30 Weekly Jobless Claims

8:30 Productivity

Fri 11/7

8:30 October Jobs

3:00 Consumer Credit

Aunt Jill on the 404: IFTTT, Apple Earnings, Credit Scores

404_wide_500px.jpg

Check my audition to be co-host of the 404 (Justin Yu is on vacation) as Jeff BakalarAriel Nunez and I discuss Jeff's favorite new toy, IFTTT ("If This, Then That"); failed NYPD hashtags; a preview of Facebook and Apple earnings; and what you need to do to improve/manage your credit score (shameless plug alert: Credit.com).

Aunt Jill on the 404: Super Bowl, Stock Market Correction, Taxes

404_wide_500px.jpg

It's my first visit of 2014 with Jeff BakalarJustin Yu and Ariel Nunez on CNET's 404. We digest the lame Super Bowl, the sad news about Philip Seymour Hoffman, my shameless plug for the idiot-proof Ventev chargers  and of course,  I answer lots of great questions from the best fans around!

Stock Market Drop: Blip or Correction?

400-05682989d.jpg

All of the sudden, those 30 percent stock market returns of 2013 seem like old news, as investors across the globe have a major case of the jitters. Worries about slowing growth in China, weakness in some US corporate earnings and the Fed's decision to curtail its bond-buying are all factors. But the biggest catalyst has been the unfolding drama in emerging markets, where local currencies have been battered. Countries that have depended on foreign investment – including Turkey, Argentina, Brazil, India, South Africa and Indonesia – are seeing a reversal of fortunes as local central banks finally take steps necessary to address  inflation and account imbalances. The fear now is that investors will pull money out of those countries, as well as other emerging markets, igniting a global sell-off in risk assets.

This latest round of selling has everyone talking about a  correction, or a drop of 10 percent or more from the peak. With yesterday’s sell-off, we are down about 4 percent from the recent peak, so we're not there yet. In fact, it's been nearly 28 months – back to the summer of 2011 – since the S&P 500 has experienced a correction. On average, the index has gone through a correction every 18 months or so since 1945.

Of course nobody knows whether the recent selling is a blip or a harbinger of scary things to come. That's why the best advice for diversified investors, who are adhering to a well thought-out game plan is to SIT STILL AND DO NOTHING. But if you have a bit too much risk in your portfolio, use this market volatility as an opportunity to review where you stand, create a target allocation and force yourself to rebalance according to your goals.

Here are 6 more tips that I periodically trot out during market gyrations:

  1. Dont let your emotions rule your financial choices. There are two emotions that tend to overly influence our financial lives: fear and greed. At market tops, greed kicks in and we tend to assume too much risk. Conversely, when the bottom falls out, fear takes over and makes us want to sell everything and hide under the bed.
  2. Maintain a diversified portfolio. One of the best ways to prevent the emotional swings that every investor faces is to create and adhere to a diversified portfolio that spreads out your risk across different asset classes, such as stocks, bonds, cash and commodities. (Owning 5 different stock funds does not qualify as a diversified portfolio!)
  3. Avoid timing the market. Repeat after me: “Nobody can time the market. Nobody can time the market.” One of the big challenges of market timing is that requires you to make not one, but two lucky decisions: when to sell and when to buy back in.
  4. Stop paying more fees than necessary. Why do investors consistently put themselves at a disadvantage by purchasing investments that carry hefty fees? Those who stick to no-commission index mutual funds start each year with a 1-2 percent advantage over those who invest in actively managed funds that carry a sales charge.
  5. Limit big risks. If you are going to make a risky investment, such as purchasing a large position in a single stock or making an investment in a tiny company, only allocate the amount of money you are willing to lose, that is, an amount that will not really affect your financial life over the long term. Yes, there are people who invest in the next Google, but just in case things don’t work out, limit your exposure to a reasonable percentage (single digits!) of your net worth.
  6. Ask for help. There are plenty of people who can manage their own financial lives, but there are also many cases where hiring a pro makes sense. Make sure that you know what services you are paying for and how your advisor is compensated. It’s best to hire a fee-only or fee-based advisor who adheres to the fiduciary standard, meaning he is required to act in your best interest. To find a fee-only advisor near you, go to NAPFA.org and to find a broader number of advisors, use the Financial Planning Association's "Find a Planner" tool.