Growth

Greece, Jeb! and Stock Corrections

11379254813_847c279e27_z1.jpg

European leaders will convene yet another emergency meeting in Brussels on Monday to discuss how and whether to restructure Greece’s debt. This may all sound like déjà vu all over again, but contrary to five years ago when the Greek drama started to unfold, today investors are less concerned that a default would take down the euro zone or the interconnected global economy. It could however, create a bout of panic in the markets. If officials do not come to an agreement, they will have no choice but to come up with a Plan B, which would likely include capital controls to limit withdrawals from Greek banks and prevent a classic run on the banks (see “It’s a Wonderful Life” for the best explanation of a bank run). In fact, about €5 billion of deposits reportedly left Greek banks last week alone. Instead of a well-orchestrated Grexit, there could be what the FT’s John Authers calls a “Graccident”, where a default would lead to a messy and de facto Grexit. Plan B would also likely include the European Central Bank’s extension of emergency loans to Greek financial institutions and Greece’s preparation of a new currency or IOU system.

As the tragedy that is Greece continues, investors seem more interested in the Federal Reserve. Last week, Chair Janet Yellen elegantly threaded the needle: Yes, the central bank would most likely raise short-term interest rates this year (probably two quarter of a percent increments), but the pace of increases will be gradual. Complicating matters for the central bankers was the first quarter, when the economy contracted by 0.7 percent. Sure, most of the slowdown was due to transitory factors, like weather, the West Coast port shutdown and $40 crude oil, but far be it for this Fed to err on the side of snuffing out potential growth.

The government will provide a third update to Q1 GDP this week, which may show marginal improvement, but most have already set their sights on the rest of the year, which should improve steadily. Because Q1 was such a stinker, growth for the total year is likely to be 2.5 percent, matching the pace of the past few years.

I usually quote the post World War II rate of growth, which is about 3.3 percent, as a benchmark, but according to the New York Times that longer term average may overstate the expected growth rate today. The reason is that “Over the last 40 years, the American economy has grown at an average of 2.8 percent per year,” which is considerably slower than the 3.7 percent average from 1948 to 1975. Additionally, the higher rate includes “two favorable trends that are now over: women entering the work force, and baby boomers reaching their prime earning years.”

The downshift in growth expectations might come as a surprise to newly minted presidential candidate Jeb Bush, who in a speech last week said that his goal for economic growth was 4 percent. The Financial Times called this figure “Fantasyland” and the NYT chimed in, saying Mr. Bush’s 4 percent goal has “close to 0 Percent Chance” at success.

MARKETS: While the NASDAQ and Russell 2000 indexes were making new highs last week, two other indexes weren’t so fortunate. The Dow Jones Transportation Average entered correction territory (a drop of more than 10 percent) for the first time in nearly four years and the Shanghai Composite lost 13.3 percent for the week, the worst week since the financial crisis and the second time this year it has fallen into correction territory. Additionally, last week brought the biggest outflows from bond funds in two years, triggered by the possibility of not one, but two, interest rate hikes later this year. These events were just more fodder for those worried investors who are convinced that the next leg for the broad U.S. market is down.

  • DJIA: 18,015, up 0.7% on week, up 1.1% YTD
  • S&P 500: 2110, up 0.8% on week, up 2.5% YTD
  • NASDAQ: 5,117 up 1.3% on week, up 8% YTD
  • Russell 2000: 1284, up 1.6% on week, up 6.6% YTD
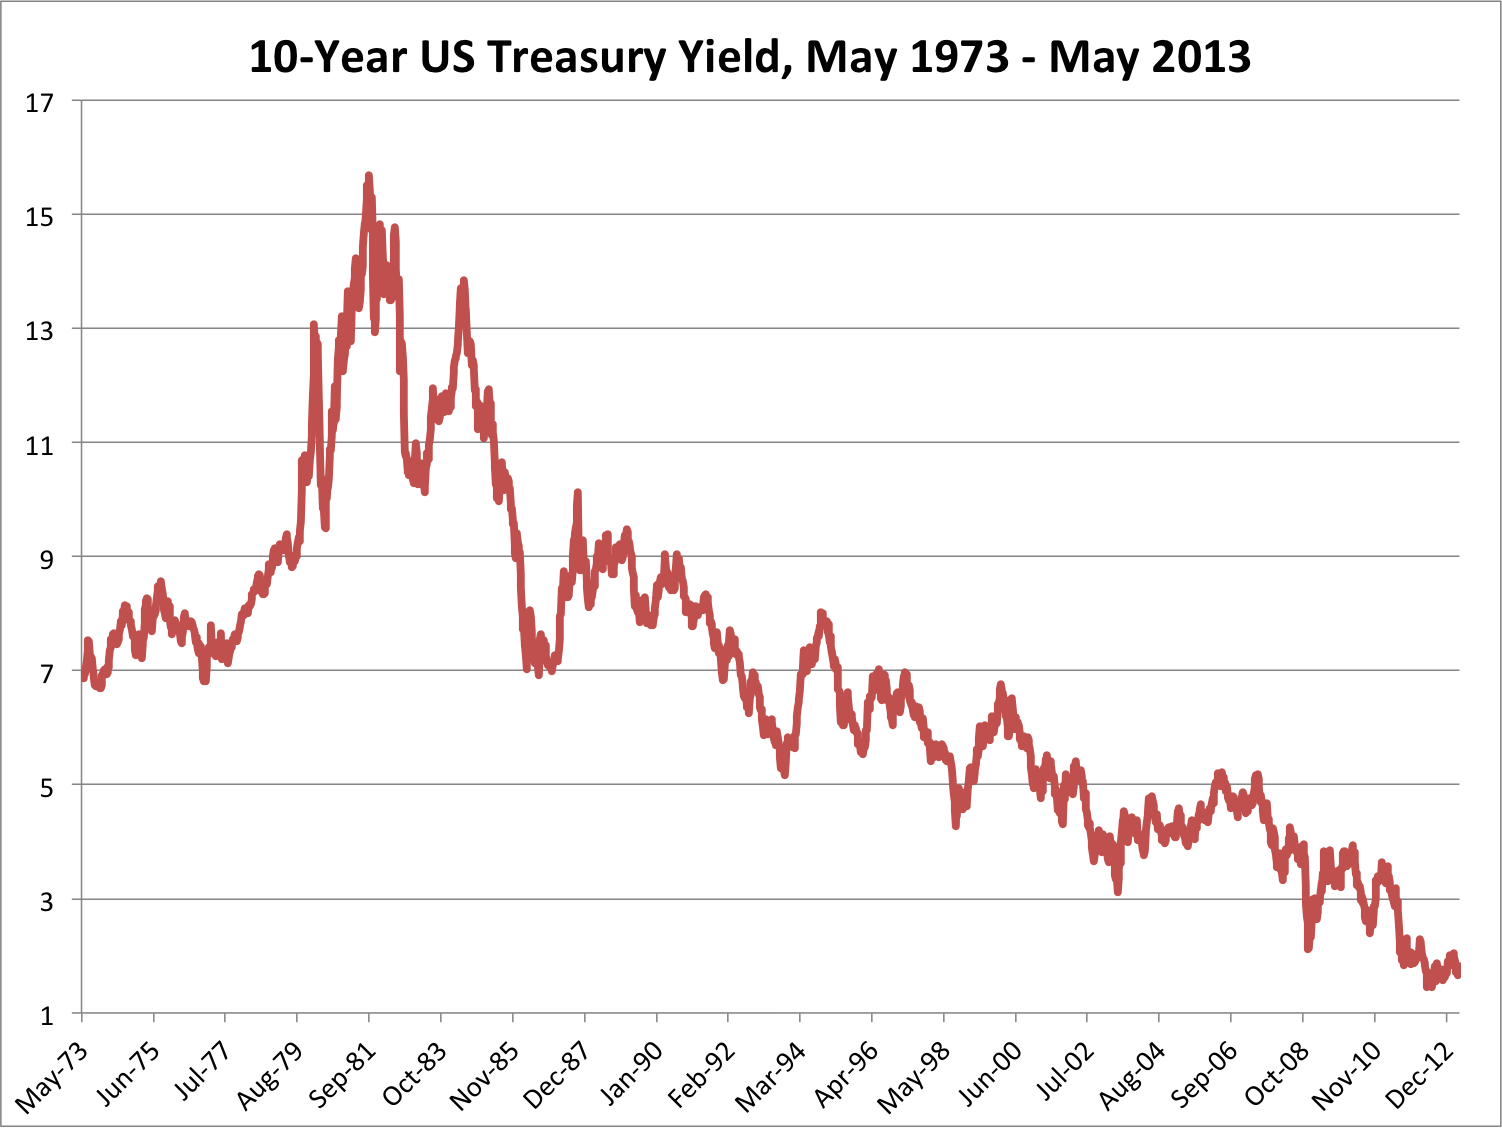
  • 10-Year Treasury yield: 2.27% (from 2.39% a week ago)
  • August Crude: $59.61, down 0.6% on week
  • August Gold: $1201.90, up 1.9% on week
  • AAA Nat'l avg. for gallon of reg. gas: $2.80 (from $2.80 wk ago, $3.68 a year ago)

THE WEEK AHEAD:

Mon 6/22:

8:30 Chicago Fed

10:00 Existing Home Sales

Tues 6/23:

8:30 Durable Goods Orders

9:00 FHFA Home Price Index

10:00 New Home Sales

Weds 6/24:

8:30 Q1 GDP – final reading (prev = -0.7%)

Thurs 6/25:

8:30 Personal Income & Spending

Fri 6/26:

10:00 Consumer Sentiment

Week ahead: Tame inflation to give central banks room to act

Japanese-Flag.jpg

Let’s review why global stocks have been marching higher since the mid-November, in order of importance:

  1. Central banks are aggressively goosing economies with lots of money
  2. Scary stuff abated (Europe not crashing, geopolitics relatively muted from market perspective)
  3. Companies are still making money, since they don’t have to add workers or increase wages

With inflation data due and a number of Fed officials speaking this week, reason #1 -- central bank action – will be in the spotlight for investors. The most recent example of central bank power is Japan. On April 4th, the Bank of Japan rolled out its on version of bond buying (QE or “Quantitative Easing”) to boost an economy that has been stagnant for nearly two decades. Japanese stocks were on tear before the announcement (up 40 percent since mid-November), but since the new plan was hatched, the Nikkei 225 has soared another 20 percent to the highest level since January 2008.

The new Japanese policy has also impacted currencies. The value of the Yen has sunk 16 percent compared to the US Dollar, which has bolstered Japanese exporters. Now, Japanese goods can be produced at lower prices for global markets and there should be increased domestic demand for local goods, which will be cheaper compared to US imports.

In addition to Japan and US central bank actions, rate cuts for Europe, Australia, Denmark, India, South Korea and Poland all tell the same story: the global economy needs helps and the Fed and its international counterparts have showed a continued willingness to stimulate growth because there is little evidence of inflation. As of March, average inflation in advanced economies dropped to its lowest level since mid-2010, at just 1.6 percent, according to Capital Economics. This benign inflation outlook provides central banks with ample time to continue their actions for the foreseeable future.

Whether or not the central bank policies will improve global economic growth, it’s clear that the actions have pushed stock markets higher. Loose monetary policy has rendered cash worthless and made bonds vulnerable in the longer term. As Fed officials speak this week, investors will be interested in how they plan to unwind their “cash is trash” policy. When they do, the 30-year bond bull market may finally come to an end and this chart will finally have an upward slope.

10 yr treas 1973-2013

Markets: The Dow and the S&P 500 finished at record levels, while the NASDAQ settled at its highest level since November 2000. The strength of the rally has been persistent: the Dow has not had a losing streak of 3 consecutive days this year — longest such streak since 1958.

  • DJIA: 15,118, up 1% on week, up 15.4% on year
  • S&P 500: 1633, up 1.2% on week, up 14.6% on year
  • NASDAQ: 3436, up 1.7% on week, up 13.8% on year
  • June Crude Oil: $96.04, up 4.5% on week
  • June Gold: $1436.6, down 1.9% on week
  • AAA Nat'l average price for gallon of regular Gas: $3.58

THE WEEK AHEAD: Retail sales are likely to drop, due to a decline in gas prices and auto sales. Meanwhile, retailers will check in with corporate earnings. With 90 percent of S&P 500 earnings in the can, profits are up 5 percent from a year ago, but revenues are only ahead by 1.3 percent.

Mon 5/13:

8:30 Retail Sales

10:00 Business Inventories

Tues 5/14:

8:30 Import/Export Prices

Weds 5/15:

Macy’s

8:30 Producer Price Index

9:15 Industrial Production

10:00 Housing Market Index

Thurs 5/16:

JC Penney, Kohl’s, Nordstrom, Wal-Mart

8:30 Weekly Claims

8:30 Consumer Price Index

8:30 Housing Starts

10:00 Philadelphia Fed Survey

Fri 5/17:

9:55 Consumer Sentiment

10:00 Leading Indicators

Week ahead: April jobs, stock market records

stockmkt.jpg

Here’s a sure sign that expectations have shifted after the Great Recession: the collective sigh of relief from economists and investors after the Labor Department said the US economy created a better than expected 165,000 jobs in April and the unemployment rate edged down to 7.5 percent, the lowest level since December 2008. These results are nothing too special. After all, 165,000 matches the average monthly job growth that has occurred over the past three years and 7.5 percent unemployment is still incredibly high. But nearly four years after the end of a once-in-a-generation recession and financial melt down, those numbers were just what was needed to soothe “spring economic slow-down” anxieties.

The internals of the report also helped to buoy sentiment: the positive revisions to both the March and February numbers added an additional 114,000 jobs than were previously reported; and there was also progress for those who have been out of work for more than 6 months. The number of long-term unemployed fell by 258,000 to 4.4 million, down from the peak of 6.7 million. Sure, that number is high, but over the past 12 months, there has been a near 700,000-drop in the total. The long term unemployed is at 2.8 percent of the labor force, which is the lowest since May 2009.

So where do we stand in all of this? When an economy only grows by about 2 percent annually, it can only produce so many new jobs, which is why nonfarm payroll jobs are still 1.9 percent below where they were when the downturn began in December 2007. At the current pace of job creation, the economy should return to pre-recession in about 18 months, at which time the unemployment rate will probably drop to 6.5 percent. That’s progress, but it sure doesn’t seem like cause for a big celebration…

Markets: While the April jobs report is subject to revision, fears that a spring slowdown would stymie job growth have yet to turn into reality, which helped the bulls take control and push the Dow above 15,000 and the S&P 500 over 1600 for the first time ever.

Not to suck the life out of the party, but it took the Dow nearly six years (1,457 trading days) to cross 15,000 after it first topped 14,000 in July 2007. This is an especially long time when compared to the shortest time frame for a 1000-point move (23 days to rise from 10,000 to 11,000), which took place in 1999. Calendar watchers take note: Dow 15,000 occurred on the 14th anniversary of the first time it crossed 11,000 (May 3, 1999), which of course is as irrelevant as the number itself.

Source: WSJ

The S&P 500’s milestone took even longer: the broad index first crossed above 1500 in March 2000, which means that it’s taken 13 years, one month and 11 days for the index to jump a mere 100 points, the fourth biggest time span separating 100-points. The shortest time occurred in 1999, when it took the index 84 days to go from 1300 to 1400.

  • DJIA: 14,973, up 1.8% on week, up 14.3% on year
  • S&P 500: 1614, up 2% on week, up 13.2% on year
  • NASDAQ: 3378, up 3% on week, up 11.9% on year
  • June Crude Oil: $95.61, up 2.8% on week
  • June Gold: $1464.20, up 0.7% on week
  • AAA Nat'l average price for gallon of regular Gas: $3.52

THE WEEK AHEAD: Investors will have plenty of time to chew on the jobs data and the market highs, as the economic calendar will be light and earnings season will be winding down.

Mon 5/6:

Tues 5/7:

Walt Disney, Whole Foods

10:00 Job Openings and Labor Turnover survey (JOLTS)

3:00 Consumer Credit

Weds 5/8:

Thurs 5/9:

Chain store sales

8:30 Weekly Claims

10:00 Wholesale inventories

Fri 5/10:

G-7 Finance ministers and central bank governors meet in London

Ben Bernanke speech at Chicago Fed banking conference

2:00 Treasury Budget

Week ahead: Econo-palooza (Income, Spending, Housing, Jobs, the Fed!)

Econo-Palooza.jpg

The first reading on Q1 GDP was a mixed message . Sure the headline seemed good: the U.S. economy grew at an annualized pace of 2.5 percent in the first quarter, which was up strongly from the fourth quarter’s meager reading of 0.4 percent and better than 2012’s pace of 2.2 percent. But the result was less than the 3 percent annualized pace that economists were expecting. The GDP report was just a warm-up for this week’s “Econo-palooza,” starting with a report on monthly Personal Income and Spending. Considering that consumers did the heavy lifting on the GDP (consumption rose at a 3.2 percent annual pace in Q1), fears over a pullback in spending may have been overblown. Perhaps the increase in payroll taxes was offset by a drop in energy prices, but the GDP report did note that there was 5.3 percent annualized drop in real disposable incomes.

Also this week, there will also be readings on: house prices; manufacturing; car sales; and monthly jobs, the big daddy of them all. After last month’s lousy employment report (just 88,000 jobs were created in March), economists estimate that April will bump up to 160,000 new jobs and that the unemployment rate will remain at 7.6 percent.

In between all of the noise, the Federal Reserve will convene its Open Market Committee meeting. The central bankers have been keeping a close eye on all of the economic indicators, all of which underscore that the U.S. economy remains in a slow-growth mode. How slow? Growth has averaged a so-so 2.1 percent over the past 15 quarters of the current recovery, well-below than the 3.4 and 2.9 percent growth rates of the previous two recoveries (early 1990’s and 2000’s).

With sub-par growth, nearly 12 million Americans out of work and no sign of inflation, the Federal Reserve is not likely to change monetary policy any time soon. That means low short-term interest rates and monthly purchases of $85 billion worth of bonds will continue, probably through 2013 and perhaps into 2014.

And just for fun, earnings season will roll on this week. About half of S&P 500 companies have reported results, with 69 percent of firms topping expectations and 20 percent missed, according to Thomson Reuters. But many of these firms are meeting or beating estimates based on cost cutting – just 42 percent of companies have beaten their revenue forecasts and on average, sales have come in 2 percent below estimates.

Markets: With the beginning of May ahead, should investors “sell in May and go away?” Since 1950, the Dow's average annual gain between November 1 and April 30 is 7.5 percent, versus the 0.3 percent gain between May 1 and October 31, according to the Stock Trader's Almanac. Then again, investors who bought stock on May 1 and held on, reinvesting dividends, had a return of 11.1 percent a year on average, topping the gain of the investors who sold in May and went away. Bottom line: ignore the rhymes and stick to your diversified, balanced portfolio!

  • DJIA: 14,712, up 1.1% on week, up 12.3% on year
  • S&P 500: 1582, up 1.7% on week, up 11% on year
  • NASDAQ: 3279, up 2.3% on week, up 8.6% on year
  • June Crude Oil: $93, up 5.4% on week
  • June Gold: $1453.60, up 4.2% on week
  • AAA Nat'l average price for gallon of regular Gas: $3.50

THE WEEK AHEAD:

Mon 4/29:

8:30 Personal Income and Spending

10:00 March Pending Homes Sales

Tues 4/30:

BP, Pfizer, UBS, NYSE Euronext, US Steel

FOMC Meeting begins

9:00 Case-Schiller Home Price Index

9:45 Chicago PMI

10:00 Consumer Confidence

Weds 5/1:

MasterCard, Merck, Time Warner, CVS Caremark, Clorox, Facebook, Visa, CBS, MetLife

Motor Vehicle Sales

8:15 ADP Private Sector employment

10:00 ISM Manufacturing Index

10:00 Construction Spending

2:00 FOMC Meeting Announcement

Thurs 5/2:

GM, Royal Dutch Shell, Kellogg, AIG, Kraft Foods

7:30 Challenger Job cuts

8:30 Weekly Claims

8:30 International Trade

8:30 Productivity and Costs

Fri 5/3:

Berkshire Hathaway

8:30 April Employment Report

10:00 Factory Orders

10:00 ISM Non-Manufacturing Index

Will slowing growth cause a spring swoon for stocks (again)?

Copper.jpg

Here we go again. For the past three years, investors sang the blues (“spring can really hang you up the most…”) as global growth fears infected sentiment and U.S. stock indexes tumbled by double digits in 2010, 2011 and 2012. The damage this year has been limited – stocks have dropped just 2.4 percent from the recent highs. But the concern over growth escalated last week, after China reported Q1 GDP of 7.7 percent, below expectations of 8 percent. As if slow growth in China and mediocre corporate earnings were not enough (see market section below), there has been bad news from every trader’s favorite Doctor, Dr. Copper. Copper is widely seen as the only commodity that holds a doctorate in economics, and the one that can most  accurately reflect the state of the global economy, because it is used in everything from pipes to high tech equipment.

Last week, Dr. Copper became eligible for bear market status, settling down 21 percent from its February 2012 high. It stands to reason that if the largest consumer of copper (China) is slowing down, demand for the industrial metal will ebb. But if the Chinese slowdown is temporary, copper and the stock market bears, may turn out to have erred in the diagnosis.

Meanwhile, growth in the U.S. likely picked up in the first quarter. GDP is expected to rise by a robust 3 percent, when the first estimate is reported on Friday. Last year ended on a sour note, as the U.S. economy expanded by just 0.4 percent, but the trend is likely to have reversed in the beginning of 2013. Investors are not likely to savor the results, because they are bracing for Q2, which is expected to be a clunker due to government spending cuts.

Markets: Last week, I pointed out that gold had been tanking, but who knew that the rout would continue so dramatically just a day later? The yellow metal cratered by 9.3 percent on Monday, the largest one-day percentage drop in over three decades. Gold  finished the week down a whopping 7 percent, and off over 25 percent from its August 2011 high print of $1920 an ounce. "Gold Bugs" will remind us that the “safe-haven” surged more than 7 fold from 2001 to 2011. Those same folks will omit that gold fell 52 percent in the 1980’s and by another 29 percent in the 1990’s. Welcome to the world of commodities!

  • DJIA: 14,547, down 2.1% on week, up 11% on year
  • S&P 500: 1555, down 2.1% on week, up 9% on year
  • NASDAQ: 3206, down 2.7% on week, up 6.2% on year
  • June Crude Oil: $88.27, down 3.6% on week
  • June Gold: $1395.60, down 7% on week
  • AAA Nat'l average price for gallon of regular Gas: $3.51

THE WEEK AHEAD: After the worst week of the year for stocks, investors remain on edge. As earnings season continues, bulls will stress that 2/3 of the companies that have reported have beaten forecasts. Meanwhile, the bears contend that only 43 percent beat their revenue numbers. Amid the battle for market direction, keep an eye on Apple, which reports quarterly results on Tuesday after the close. The stock has tumbled nearly 45 percent since its September high of $705 and is down over 26 percent year to date.

Mon 4/22:

Halliburton, Caterpillar, Texas Instruments

10:00 March Existing Homes Sales

Tues 4/23:

Apple, AT&T, DuPont

8:30 March New Home Sales

Weds 4/24:

Boeing, Proctor & Gamble, Ford

8:30 March Durable Goods

Thurs 4/25:

UPS, 3M, Amazon, Starbucks, Exxon Mobil, Altria

8:30 Weekly Claims

Fri 4/26:

Chevron

8:30 Q1 GDP

9:55 U Michigan Sentiment