S&P 1600

Week ahead: What Bernanke should say

Bernanke-dollars.jpg

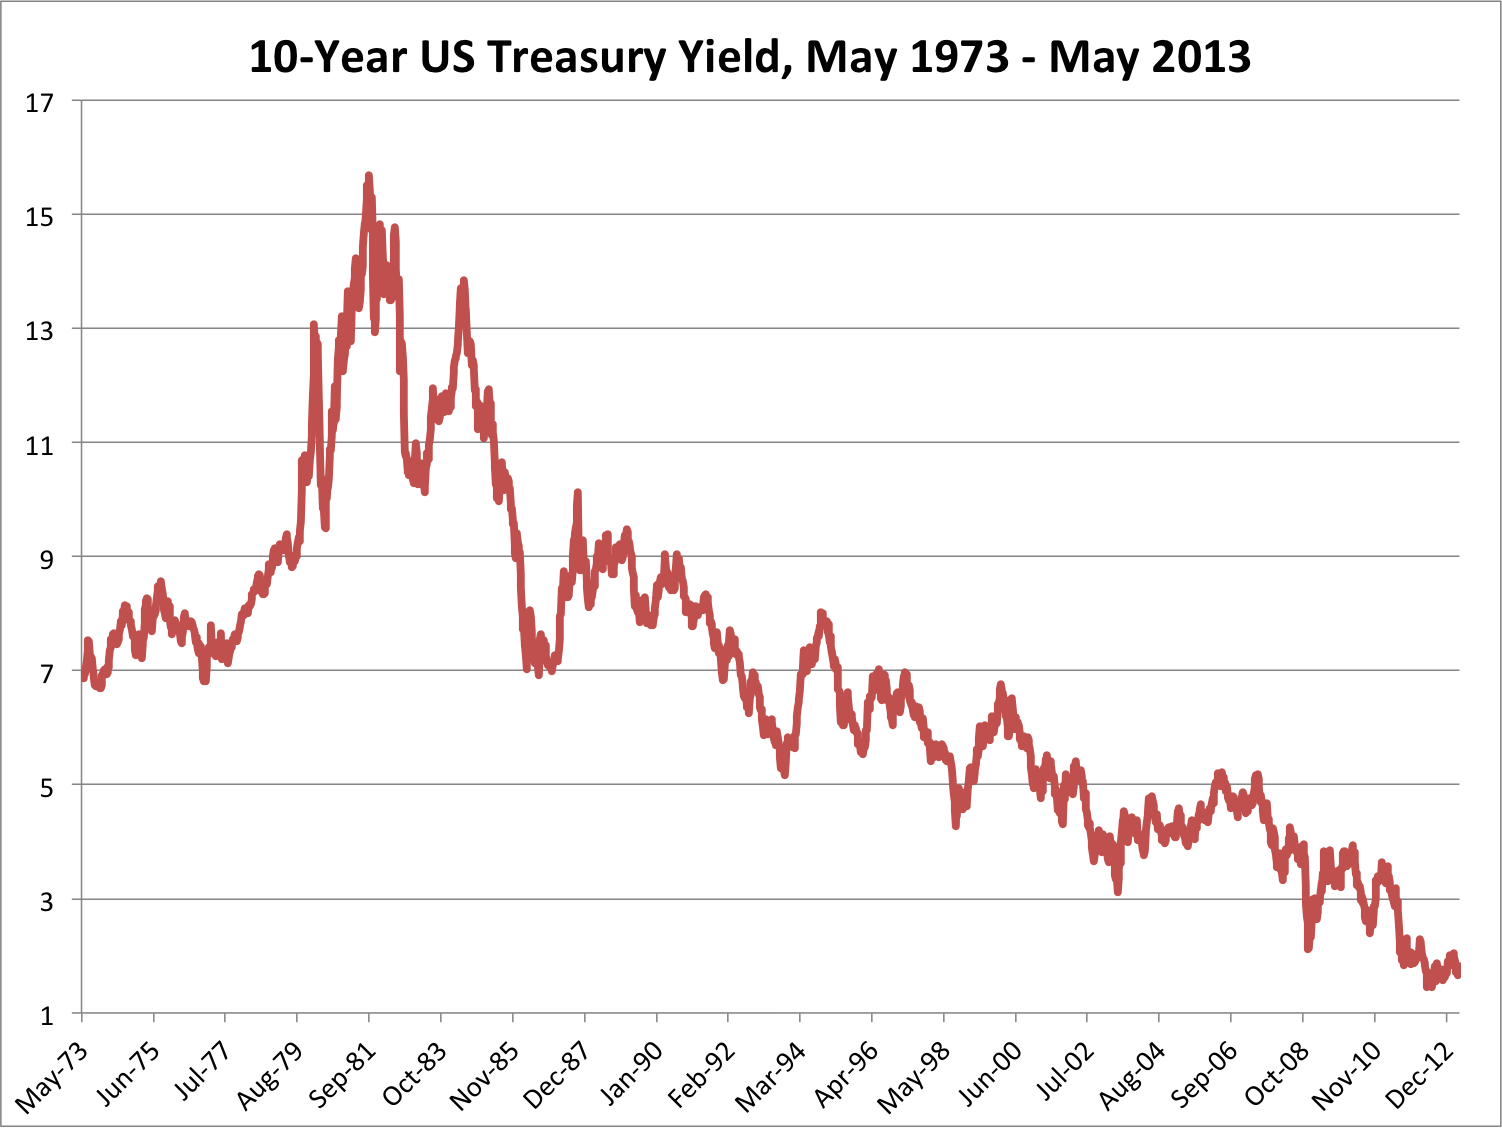
Here’s what I wish Ben Bernanke would say to Congress this week: “Stop worrying about inflation and fretting about when we are going to stop buying bonds…instead, start thinking about deflation and why the globe is slowing down.” Let me explain. Despite stock indexes rising to new nominal record highs last week (and being up 23 percent in the past six months without a 5 percent correction,) these days, most of the chatter on trading floors boils down to a simple question: When will the Fed taper its monthly purchase of $85 billion worth of bonds? Some are worried that as the US economy improves, the Fed will remove the punch bowl of easy money, which would likely mean a pause in the stock market rally and an end to the 30-year bull-run for bonds.

That’s why all eyes will be on Federal Reserve Chairman Ben Bernanke, as he testifies before Congressional subcommittees this week about the state of the economy and current Fed policies. It’s expected that Bernanke will reiterate that the central bank plans to pump money into the system at least until the unemployment rate drops to 6.5 percent from its current level of 7.5 percent. But stable employment is only half of the Fed’s dual mandate: it is also supposed to maintain stable prices.

Over the past 30 years, price stability has generally meant that the Fed would use its toolkit to fight inflation, but with tame readings on prices across most of the globe, the world's central bankers might have to confront new enemies: deflation (falling prices) and disinflation (slowing of price increases).

It would be great if during his testimony, Bernanke underscored that the biggest problem facing the economy is weak demand and falling prices, not runaway inflation. For all of the hand wringing over the Fed’s “money-printing” policies, there is no evidence of inflation. The Consumer Price Index (CPI)  fell to a 2 ½-year low of 1.1 percent year-over-year and core inflation, which removes the volatile energy and food categories, tumbled to a 22-month low of 1.7 percent, below the 2 percent level that the Federal Reserve targets.

What does this all mean? With prices falling, manufacturing slowing and unemployment still high, it’s hard to see why the Fed would alter its current policy. That may mean that the stock market has room to run, especially as investors who have pooh-poohed the rally, now scramble to pile in. A good old fashioned melt-up is occurring before our very eyes!

Markets: With new nominal highs for the Dow and the S&P 500, you might have forgotten about two social media IPO anniversaries. Facebook went public on 5/18/12 and one year hence, the stock is down 31 percent. There was a bit more to celebrate at LinkedIn, where 2-years after its IPO (5/19/11), the stock us up 96 percent.

  • DJIA: 15,354, up 1.6% on week, up 17.2% on year
  • S&P 500: 1667, up 2% on week, up 16.9% on year (up 1,000 points or 150% since 3/09)
  • NASDAQ: 3499, up 1.8% on week, up 15.9% on year
  • June Crude Oil: $96.29, up .01% on week
  • June Gold: $1364.70, down 5% on week (down 18.5% year to date)
  • AAA Nat'l average price for gallon of regular Gas: $3.64

THE WEEK AHEAD:

Mon 5/20:

8:30 Chicago Fed National Activity

Tues 5/21:

Weds 5/22:

10:00 Existing Home Sales

10:00 Ben Bernanke to testify on US economy before Congressional subcommittees

2:00 Fed minutes released

Thurs 5/23:

8:30 Weekly Claims

9:00 FHFA Home Price Index

10:00 New Home Sales

Fri 5/24:

8:30 Durable Goods Orders

Week ahead: Tame inflation to give central banks room to act

Japanese-Flag.jpg

Let’s review why global stocks have been marching higher since the mid-November, in order of importance:

  1. Central banks are aggressively goosing economies with lots of money
  2. Scary stuff abated (Europe not crashing, geopolitics relatively muted from market perspective)
  3. Companies are still making money, since they don’t have to add workers or increase wages

With inflation data due and a number of Fed officials speaking this week, reason #1 -- central bank action – will be in the spotlight for investors. The most recent example of central bank power is Japan. On April 4th, the Bank of Japan rolled out its on version of bond buying (QE or “Quantitative Easing”) to boost an economy that has been stagnant for nearly two decades. Japanese stocks were on tear before the announcement (up 40 percent since mid-November), but since the new plan was hatched, the Nikkei 225 has soared another 20 percent to the highest level since January 2008.

The new Japanese policy has also impacted currencies. The value of the Yen has sunk 16 percent compared to the US Dollar, which has bolstered Japanese exporters. Now, Japanese goods can be produced at lower prices for global markets and there should be increased domestic demand for local goods, which will be cheaper compared to US imports.

In addition to Japan and US central bank actions, rate cuts for Europe, Australia, Denmark, India, South Korea and Poland all tell the same story: the global economy needs helps and the Fed and its international counterparts have showed a continued willingness to stimulate growth because there is little evidence of inflation. As of March, average inflation in advanced economies dropped to its lowest level since mid-2010, at just 1.6 percent, according to Capital Economics. This benign inflation outlook provides central banks with ample time to continue their actions for the foreseeable future.

Whether or not the central bank policies will improve global economic growth, it’s clear that the actions have pushed stock markets higher. Loose monetary policy has rendered cash worthless and made bonds vulnerable in the longer term. As Fed officials speak this week, investors will be interested in how they plan to unwind their “cash is trash” policy. When they do, the 30-year bond bull market may finally come to an end and this chart will finally have an upward slope.

10 yr treas 1973-2013

Markets: The Dow and the S&P 500 finished at record levels, while the NASDAQ settled at its highest level since November 2000. The strength of the rally has been persistent: the Dow has not had a losing streak of 3 consecutive days this year — longest such streak since 1958.

  • DJIA: 15,118, up 1% on week, up 15.4% on year
  • S&P 500: 1633, up 1.2% on week, up 14.6% on year
  • NASDAQ: 3436, up 1.7% on week, up 13.8% on year
  • June Crude Oil: $96.04, up 4.5% on week
  • June Gold: $1436.6, down 1.9% on week
  • AAA Nat'l average price for gallon of regular Gas: $3.58

THE WEEK AHEAD: Retail sales are likely to drop, due to a decline in gas prices and auto sales. Meanwhile, retailers will check in with corporate earnings. With 90 percent of S&P 500 earnings in the can, profits are up 5 percent from a year ago, but revenues are only ahead by 1.3 percent.

Mon 5/13:

8:30 Retail Sales

10:00 Business Inventories

Tues 5/14:

8:30 Import/Export Prices

Weds 5/15:

Macy’s

8:30 Producer Price Index

9:15 Industrial Production

10:00 Housing Market Index

Thurs 5/16:

JC Penney, Kohl’s, Nordstrom, Wal-Mart

8:30 Weekly Claims

8:30 Consumer Price Index

8:30 Housing Starts

10:00 Philadelphia Fed Survey

Fri 5/17:

9:55 Consumer Sentiment

10:00 Leading Indicators

Week ahead: April jobs, stock market records

stockmkt.jpg

Here’s a sure sign that expectations have shifted after the Great Recession: the collective sigh of relief from economists and investors after the Labor Department said the US economy created a better than expected 165,000 jobs in April and the unemployment rate edged down to 7.5 percent, the lowest level since December 2008. These results are nothing too special. After all, 165,000 matches the average monthly job growth that has occurred over the past three years and 7.5 percent unemployment is still incredibly high. But nearly four years after the end of a once-in-a-generation recession and financial melt down, those numbers were just what was needed to soothe “spring economic slow-down” anxieties.

The internals of the report also helped to buoy sentiment: the positive revisions to both the March and February numbers added an additional 114,000 jobs than were previously reported; and there was also progress for those who have been out of work for more than 6 months. The number of long-term unemployed fell by 258,000 to 4.4 million, down from the peak of 6.7 million. Sure, that number is high, but over the past 12 months, there has been a near 700,000-drop in the total. The long term unemployed is at 2.8 percent of the labor force, which is the lowest since May 2009.

So where do we stand in all of this? When an economy only grows by about 2 percent annually, it can only produce so many new jobs, which is why nonfarm payroll jobs are still 1.9 percent below where they were when the downturn began in December 2007. At the current pace of job creation, the economy should return to pre-recession in about 18 months, at which time the unemployment rate will probably drop to 6.5 percent. That’s progress, but it sure doesn’t seem like cause for a big celebration…

Markets: While the April jobs report is subject to revision, fears that a spring slowdown would stymie job growth have yet to turn into reality, which helped the bulls take control and push the Dow above 15,000 and the S&P 500 over 1600 for the first time ever.

Not to suck the life out of the party, but it took the Dow nearly six years (1,457 trading days) to cross 15,000 after it first topped 14,000 in July 2007. This is an especially long time when compared to the shortest time frame for a 1000-point move (23 days to rise from 10,000 to 11,000), which took place in 1999. Calendar watchers take note: Dow 15,000 occurred on the 14th anniversary of the first time it crossed 11,000 (May 3, 1999), which of course is as irrelevant as the number itself.

Source: WSJ

The S&P 500’s milestone took even longer: the broad index first crossed above 1500 in March 2000, which means that it’s taken 13 years, one month and 11 days for the index to jump a mere 100 points, the fourth biggest time span separating 100-points. The shortest time occurred in 1999, when it took the index 84 days to go from 1300 to 1400.

  • DJIA: 14,973, up 1.8% on week, up 14.3% on year
  • S&P 500: 1614, up 2% on week, up 13.2% on year
  • NASDAQ: 3378, up 3% on week, up 11.9% on year
  • June Crude Oil: $95.61, up 2.8% on week
  • June Gold: $1464.20, up 0.7% on week
  • AAA Nat'l average price for gallon of regular Gas: $3.52

THE WEEK AHEAD: Investors will have plenty of time to chew on the jobs data and the market highs, as the economic calendar will be light and earnings season will be winding down.

Mon 5/6:

Tues 5/7:

Walt Disney, Whole Foods

10:00 Job Openings and Labor Turnover survey (JOLTS)

3:00 Consumer Credit

Weds 5/8:

Thurs 5/9:

Chain store sales

8:30 Weekly Claims

10:00 Wholesale inventories

Fri 5/10:

G-7 Finance ministers and central bank governors meet in London

Ben Bernanke speech at Chicago Fed banking conference

2:00 Treasury Budget