S&P 500

Why We're Lousy Investors

8196333166_85aa0005a6_z.jpg

Despite the best efforts of the financial services industry, not to mention the coterie of press outlets slavishly devoted to the professionals that populate the field, investing should not be very complicated. We can break down the process into six steps:

  1. Figure what you are trying to accomplish and be concrete. For example, “I want to save for retirement so that I can live the same way that I live today”, or “I want to fund two years of my kid’s college education” or “I want to save $100,000 for a down payment on a home”.
  2. Determine how much money the goal will require (choose from the myriad of online calculators) and then see how much money you have available to fund the stated goal.
  3. Measure how much risk you can manage on the way to achieving your goal -- try a few different risk assessment tools to assist.
  4. Create an asset allocation plan of assets that act differently when markets zig and zag. Don’t fret too much about creating the “perfect” model, because as noted in the Financial Times “the precise asset allocation model you use is less important than keeping control of fees.” In general, index funds help limit fees.
  5. Stick to the allocation by rebalancing on a periodic basis (annually, semi-annually or quarterly).
  6. Shift the allocation as your goal nears or if circumstances in your life change.

If only it were so easy! The problem is that we are human beings and as such, we have these darned emotions, which can often lead us astray at the wrong times and make us lousy investors. A recent article “Understanding Behavioral Aspects of Financial Planning and Investing” in the Journal of Financial Planning outlined the issue perfectly: “Emotional processes, mental mistakes, and individual personality traits complicate investment decisions.”

Do they ever! Because of hard-wired tendencies to fall prey to fear, greed, doubt and even regret, many are not inherently rational when it comes to managing money. The emotional aspect to investing explains why in countless studies, mutual fund investors significantly underperform the S&P 500 stock index. The most recent Dalbar Quantitative Analysis of Investor Behavior study found that the average stock fund investor lagged the S&P 500 by 4.2 percentage points per year from 1994 to 2013. The reason is easy to understand: When markets are soaring, investors feel invincible and when they are plunging, they erroneously believe everything is going to zero and bail out.

How can you avoid being a lousy investor? Start by coming clean. Right now, when markets are in decent shape and nothing frightening is occurring, take a look back at your investor behavior. Over the past ten years, have you been reactive to events or have you mostly been able to stick to the six steps outlined above? Are you generally worried about your investments? Some degree of worry is healthy, but you know the difference between a healthy respect for the volatility of markets and the anxiety that robs you of sleep.

If you are concerned about your ability to weather the next market downturn without shooting yourself in the foot or are plagued by self-doubt about your investments, then go back to the drawing board and see if you can auto-correct by walking through the six steps.

But investing is not for everyone. The authors of the Journal of Financial Planning article quote Benjamin Graham, the founder of security analysis, “Individuals who cannot master their emotions are ill-suited to profit from the investment process.” If you fear that you may be your own worst enemy when it comes to investing, there is no shame in seeking the assistance of a qualified financial planner.

I suggest that you stick to an advisor who is a fiduciary; that is, one that is obligated to put your needs before hers or before her firm’s. Two of the designations that hold its professionals to the fiduciary duty are the Certified Financial Planner (CFP®) certification and CPA Personal Financial Specialist (PFS).

Jobs Report Fosters Market Milestones

7382239368_ba418d5b73_z.jpg

The labor market closed out the first-half of the year with strong gains. The economy created a greater than expected 288,000 jobs in June and the unemployment rate fell to 6.1 percent, the lowest level since September 2008. Unlike some of the previous reports, this drop in rate occurred for the right reason: more people found jobs while the size of the workforce remained relatively steady. The June results bring total average monthly job creation this year to 231,000, 19 percent faster than last year’s pace and the economy is on track to add more jobs this year than any year since 1999. Still, there are obvious big problems that linger: there are still 9.5 million unemployed Americans, of which about a third (3.1 million) have been out of work for more than six months; many of the new jobs created continue to be in low wage areas like retail and food and drinking establishments; and wage growth remains stubbornly low at just two percent over the past 12 months.

Still, the June report felt like turning point and to celebrate, investors pushed US stock indexes into new record territory. The Dow broke out above the 17,000 level for the first time ever, the S&P 500 is knocking on the door of 2,000 and NASDAQ 5,000 does not seem like such a crazy pipe dream anymore.

This week, it’s back to business as we head into earnings season. According to Fact Set, the estimated earnings growth rate for S&P 500 companies in the second quarter is 5.1 percent, which is down from estimates three months ago of over 6 percent growth. The telecom services sector expected to lead the way; and the financial sector is likely to bring up the rear. Mid-week, minutes from the Federal Reserve’s recent policy meeting will be released. Fed watchers will parse the central bank officials’ assessment of the current economy, seeking clues as to when short term interest rates may rise. Given the recent buoyancy of economic data, the central bank may be rethinking its timing.

MARKETS:

  • DJIA: 17,068, up 0.7% on week, up 3% YTD (7 ½ months to go from 16K to 17K, the seventh-fastest 1000-point gain in the index's history)
  • S&P 500: 1985, up 0.7% on week, up 7.4% YTD
  • NASDAQ: 4,486, up 1.4% on week, up 7.4% YTD
  • 10-Year Treasury yield: 2.64% (from 2.53% a week ago)
  • August Crude Oil: $104.06, down 1.6% on week
  • August Gold: $1320.60, flat on week
  • AAA Nat'l average price for gallon of regular Gas: $3.67 (from $3.48 a year ago)

THE WEEK AHEAD:

Mon 7/7:

Tues 7/8:

Alcoa

7:30 NFIB Small Bus Optimism

10:00 JOLTS

3:00 Consumer Credit

Weds 7/9:

2:00 FOMC Minutes

Thurs 7/10:

8:30 Weekly Jobless Claims

Fri 7/11:

Wells Fargo

Dow and S&P Reach Milestones: Bubble Fears Arise

400-04385890d.jpg

The Dow pierced the 16,000 level for the first time ever - and perhaps more impressively, it made the jump from 15,000 to 16,000 in just six months. The S&P 500 poked above 1800 in less than 4 months after taking out 1700. To put the rapid rise into context, after first reaching 1500 in March 2000, it took the broad index 13 years to reclaim that level. For tech fans, the NASADAQ recently touched 4,000, a level not seen since September of 2000. Although the economy has improved and corporate profits continue to surpass expectations, the Federal Reserve is responsible for the lion’s share of the stock market’s move higher over the past year. Without low short-term interest rates (0 to 0.25 percent since December 2008) and $85 billion worth of monthly bond buying, it’s hard to build a case where stocks would be at these levels.

But we are where we are. The S&P 500 is up 26 percent this year and has risen by 166 percent since the March 2009 lows, which means that bubble fears are arising anew. The bears point to troubling signs, including: ordinary investors are finally buying back in -- money is pouring into stock mutual funds and exchange-traded funds at the highest rate in four years; investor sentient has become almost uniformly optimistic; borrowing to purchase stocks is at record levels; and the main gauge of investor fear is low. Some warn that taken together, investors are becoming complacent, setting everyone up for a correction, which is a pull-back of more than 10 percent.

But just because a correction could be coming, does not mean you should bail out. If you are a long-term investor with a 15 or 20-year time horizon, there is no reason to alter your game plan – use the new highs to rebalance and keep investing in a diversified portfolio. But if you are the kind of person who simply cannot handle the ups and downs of the stock market, remember that just because stocks are higher, does not make them any safer. Please use caution before jumping back in!

Even if new milestones don’t really mean too much, I am happy to use them as an opportunity to remind you to review where you stand, create a target allocation and force yourself to rebalance according to your goals.

Here's what smart money has known forever--the quicker you learn these rules, the better:

Don’t let your emotions rule your financial choices. There are two emotions that tend to overly influence our financial lives: fear and greed. At market tops, greed kicks in and we tend to assume too much risk. Conversely, when the bottom falls out, fear takes over and makes us want to sell everything and hide under the bed.

Maintain a diversified portfolio. One of the best ways to prevent the emotional swings that every investor faces is to create and adhere to a diversified portfolio that spreads out your risk across different asset classes, such as stocks, bonds, cash and commodities. (Owning 5 different stock funds does not qualify as a diversified portfolio!)

Avoid timing the market. Repeat after me: “Nobody can time the market. Nobody can time the market.” One of the big challenges of market timing is that requires you to make not one, but two lucky decisions: when to sell and when to buy back in.

Stop paying more fees than necessary. Why do investors consistently put themselves at a disadvantage by purchasing investments that carry hefty fees? Those who stick to no-commission index mutual funds start each year with a 1-2 percent advantage over those who invest in actively managed funds that carry a sales charge.

Limit big risks. If you are going to make a risky investment, such as purchasing a large position in a single stock or making an investment in a tiny company, only allocate the amount of money you are willing to lose, that is, an amount that will not really affect your financial life over the long term. Yes, there are people who invest in the next Google, but just in case things don’t work out, limit your exposure to a reasonable percentage (single digits!) of your net worth.

Ask for help. There are plenty of people who can manage their own financial lives, but there are also many cases where hiring a pro makes sense. Make sure that you know what services you are paying for and how your advisor is compensated. It’s best to hire a fee-only or fee-based advisor who adheres to the fiduciary standard, meaning he is required to act in your best interest. To find a fee-only advisor near you, go to NAPFA.org.

For those who want to protect their portfolios against the eventual rise in interest rates, you may be tempted to sell all of your bonds. But of course that would be market timing and you are not going to fall for that, are you? Here are alternatives to a wholesale dismissal of the fixed income asset class:

Lower your duration. This can be as easy as moving from a longer-term bond into a shorter one. Of course, when you go shorter, you will give up yield. It may be worth it for you to make a little less current income in exchange for diminished volatility in your portfolio.

Use corporate bonds. Corporate bonds are less sensitive to interest-rate risk than government bonds. This does not mean that corporate bonds will avoid losses in a rising interest rate environment, but the declines are usually less than those for Treasuries.

Explore floating rate notes. Floating rate loan funds invest in non-investment-grade bank loans whose coupons “float” based on the prevailing interest rate market, which allows them to reduce duration risk.

Keep extra cash on hand. Cash, the ultimate fixed asset, can provide you with a unique opportunity in a rising interest rate market: the ability to purchase higher yielding securities on your own timetable.

Dow, S&P Records: What to do now

400-04385890d.jpg

For the 26th time this year, the Dow finished at an all-time nominal closing record and the broader S&P 500 saw it’s 20th record close of the year. This year, stocks are up about 18 percent – an amazing performance, but (buzz-kill alert) we there is still quite a ways to go to reclaim new highs, when adjusted for inflation: the Dow has to rise above to 15,730 and the S&P 500 has an even steeper climb to over 2,000. Don’t even start to calculate the NASDAQ, which needs to add another 1425 points to get back to the nominal closing high. We all know that Ben Bernanke’s Federal Reserve is responsible for the lion’s share of the stock market’s move higher. Without low short-term interest rates (0 to 0.25 percent since December 2008) and $85 billion worth of monthly bond buying, it’s hard to build a case where stocks would be at these levels. That’s why all eyes have been on Bernanke over the past 8 weeks, as he has tried to explain under what circumstances the central bank would taper its bond purchases.

There will be another chance for a taper-tantrum this week, when Bernanke provides his semi-annual testimony to the House and Senate. That means you have a couple of days to force yourself to rebalance your investment accounts.

Remember that just because stock are up, does not make them safe. If you are the kind of person who simply cannot handle the ups and downs of the stock market, then your inclination is probably to avoid stocks at all costs. But what if you kept your stock allocation to a level where they gyrations didn’t cause you to lose sleep? Maybe a stock allocation of 10 to 20 percent of your portfolio would allow you partially participate over time, but not get your hat handed to you if/when the bottom falls out.

Even if new records don’t really mean too much, I am happy to use them as an opportunity to remind you to review where you stand, create a target allocation and force yourself to rebalance according to your goals.

Here's what smart money has known forever--the quicker you learn these rules, the better:

Don’t let your emotions rule your financial choices. There are two emotions that tend to overly influence our financial lives: fear and greed. At market tops, greed kicks in and we tend to assume too much risk. Conversely, when the bottom falls out, fear takes over and makes us want to sell everything and hide under the bed.

Maintain a diversified portfolio. One of the best ways to prevent the emotional swings that every investor faces is to create and adhere to a diversified portfolio that spreads out your risk across different asset classes, such as stocks, bonds, cash and commodities. (Owning 5 different stock funds does not qualify as a diversified portfolio!)

Avoid timing the market. Repeat after me: “Nobody can time the market. Nobody can time the market.” One of the big challenges of market timing is that requires you to make not one, but two lucky decisions: when to sell and when to buy back in.

Stop paying more fees than necessary. Why do investors consistently put themselves at a disadvantage by purchasing investments that carry hefty fees? Those who stick to no-commission index mutual funds start each year with a 1-2 percent advantage over those who invest in actively managed funds that carry a sales charge.

Limit big risks. If you are going to make a risky investment, such as purchasing a large position in a single stock or making an investment in a tiny company, only allocate the amount of money you are willing to lose, that is, an amount that will not really affect your financial life over the long term. Yes, there are people who invest in the next Google, but just in case things don’t work out, limit your exposure to a reasonable percentage (single digits!) of your net worth.

Ask for help. There are plenty of people who can manage their own financial lives, but there are also many cases where hiring a pro makes sense. Make sure that you know what services you are paying for and how your advisor is compensated. It’s best to hire a fee-only or fee-based advisor who adheres to the fiduciary standard, meaning he is required to act in your best interest. To find a fee-only advisor near you, go to NAPFA.org.

For those who want to protect their portfolios against the eventual rise in interest rates, you may be tempted to sell all of your bonds. But of course that would be market timing and you are not going to fall for that, are you? Here are alternatives to a wholesale dismissal of the fixed income asset class:

Lower your duration. This can be as easy as moving from a longer-term bond into a shorter one. Of course, when you go shorter, you will give up yield. It may be worth it for you to make a little less current income in exchange for diminished volatility in your portfolio.

Use corporate bonds. Corporate bonds are less sensitive to interest-rate risk than government bonds. This does not mean that corporate bonds will avoid losses in a rising interest rate environment, but the declines are usually less than those for Treasuries.

Explore floating rate notes. Floating rate loan funds invest in non-investment-grade bank loans whose coupons “float” based on the prevailing interest rate market, which allows them to reduce duration risk.

Keep extra cash on hand. Cash, the ultimate fixed asset, can provide you with a unique opportunity in a rising interest rate market: the ability to purchase higher yielding securities on your own timetable.

Week ahead: What Bernanke should say

Bernanke-dollars.jpg

Here’s what I wish Ben Bernanke would say to Congress this week: “Stop worrying about inflation and fretting about when we are going to stop buying bonds…instead, start thinking about deflation and why the globe is slowing down.” Let me explain. Despite stock indexes rising to new nominal record highs last week (and being up 23 percent in the past six months without a 5 percent correction,) these days, most of the chatter on trading floors boils down to a simple question: When will the Fed taper its monthly purchase of $85 billion worth of bonds? Some are worried that as the US economy improves, the Fed will remove the punch bowl of easy money, which would likely mean a pause in the stock market rally and an end to the 30-year bull-run for bonds.

That’s why all eyes will be on Federal Reserve Chairman Ben Bernanke, as he testifies before Congressional subcommittees this week about the state of the economy and current Fed policies. It’s expected that Bernanke will reiterate that the central bank plans to pump money into the system at least until the unemployment rate drops to 6.5 percent from its current level of 7.5 percent. But stable employment is only half of the Fed’s dual mandate: it is also supposed to maintain stable prices.

Over the past 30 years, price stability has generally meant that the Fed would use its toolkit to fight inflation, but with tame readings on prices across most of the globe, the world's central bankers might have to confront new enemies: deflation (falling prices) and disinflation (slowing of price increases).

It would be great if during his testimony, Bernanke underscored that the biggest problem facing the economy is weak demand and falling prices, not runaway inflation. For all of the hand wringing over the Fed’s “money-printing” policies, there is no evidence of inflation. The Consumer Price Index (CPI)  fell to a 2 ½-year low of 1.1 percent year-over-year and core inflation, which removes the volatile energy and food categories, tumbled to a 22-month low of 1.7 percent, below the 2 percent level that the Federal Reserve targets.

What does this all mean? With prices falling, manufacturing slowing and unemployment still high, it’s hard to see why the Fed would alter its current policy. That may mean that the stock market has room to run, especially as investors who have pooh-poohed the rally, now scramble to pile in. A good old fashioned melt-up is occurring before our very eyes!

Markets: With new nominal highs for the Dow and the S&P 500, you might have forgotten about two social media IPO anniversaries. Facebook went public on 5/18/12 and one year hence, the stock is down 31 percent. There was a bit more to celebrate at LinkedIn, where 2-years after its IPO (5/19/11), the stock us up 96 percent.

  • DJIA: 15,354, up 1.6% on week, up 17.2% on year
  • S&P 500: 1667, up 2% on week, up 16.9% on year (up 1,000 points or 150% since 3/09)
  • NASDAQ: 3499, up 1.8% on week, up 15.9% on year
  • June Crude Oil: $96.29, up .01% on week
  • June Gold: $1364.70, down 5% on week (down 18.5% year to date)
  • AAA Nat'l average price for gallon of regular Gas: $3.64

THE WEEK AHEAD:

Mon 5/20:

8:30 Chicago Fed National Activity

Tues 5/21:

Weds 5/22:

10:00 Existing Home Sales

10:00 Ben Bernanke to testify on US economy before Congressional subcommittees

2:00 Fed minutes released

Thurs 5/23:

8:30 Weekly Claims

9:00 FHFA Home Price Index

10:00 New Home Sales

Fri 5/24:

8:30 Durable Goods Orders

Week ahead: Tame inflation to give central banks room to act

Japanese-Flag.jpg

Let’s review why global stocks have been marching higher since the mid-November, in order of importance:

  1. Central banks are aggressively goosing economies with lots of money
  2. Scary stuff abated (Europe not crashing, geopolitics relatively muted from market perspective)
  3. Companies are still making money, since they don’t have to add workers or increase wages

With inflation data due and a number of Fed officials speaking this week, reason #1 -- central bank action – will be in the spotlight for investors. The most recent example of central bank power is Japan. On April 4th, the Bank of Japan rolled out its on version of bond buying (QE or “Quantitative Easing”) to boost an economy that has been stagnant for nearly two decades. Japanese stocks were on tear before the announcement (up 40 percent since mid-November), but since the new plan was hatched, the Nikkei 225 has soared another 20 percent to the highest level since January 2008.

The new Japanese policy has also impacted currencies. The value of the Yen has sunk 16 percent compared to the US Dollar, which has bolstered Japanese exporters. Now, Japanese goods can be produced at lower prices for global markets and there should be increased domestic demand for local goods, which will be cheaper compared to US imports.

In addition to Japan and US central bank actions, rate cuts for Europe, Australia, Denmark, India, South Korea and Poland all tell the same story: the global economy needs helps and the Fed and its international counterparts have showed a continued willingness to stimulate growth because there is little evidence of inflation. As of March, average inflation in advanced economies dropped to its lowest level since mid-2010, at just 1.6 percent, according to Capital Economics. This benign inflation outlook provides central banks with ample time to continue their actions for the foreseeable future.

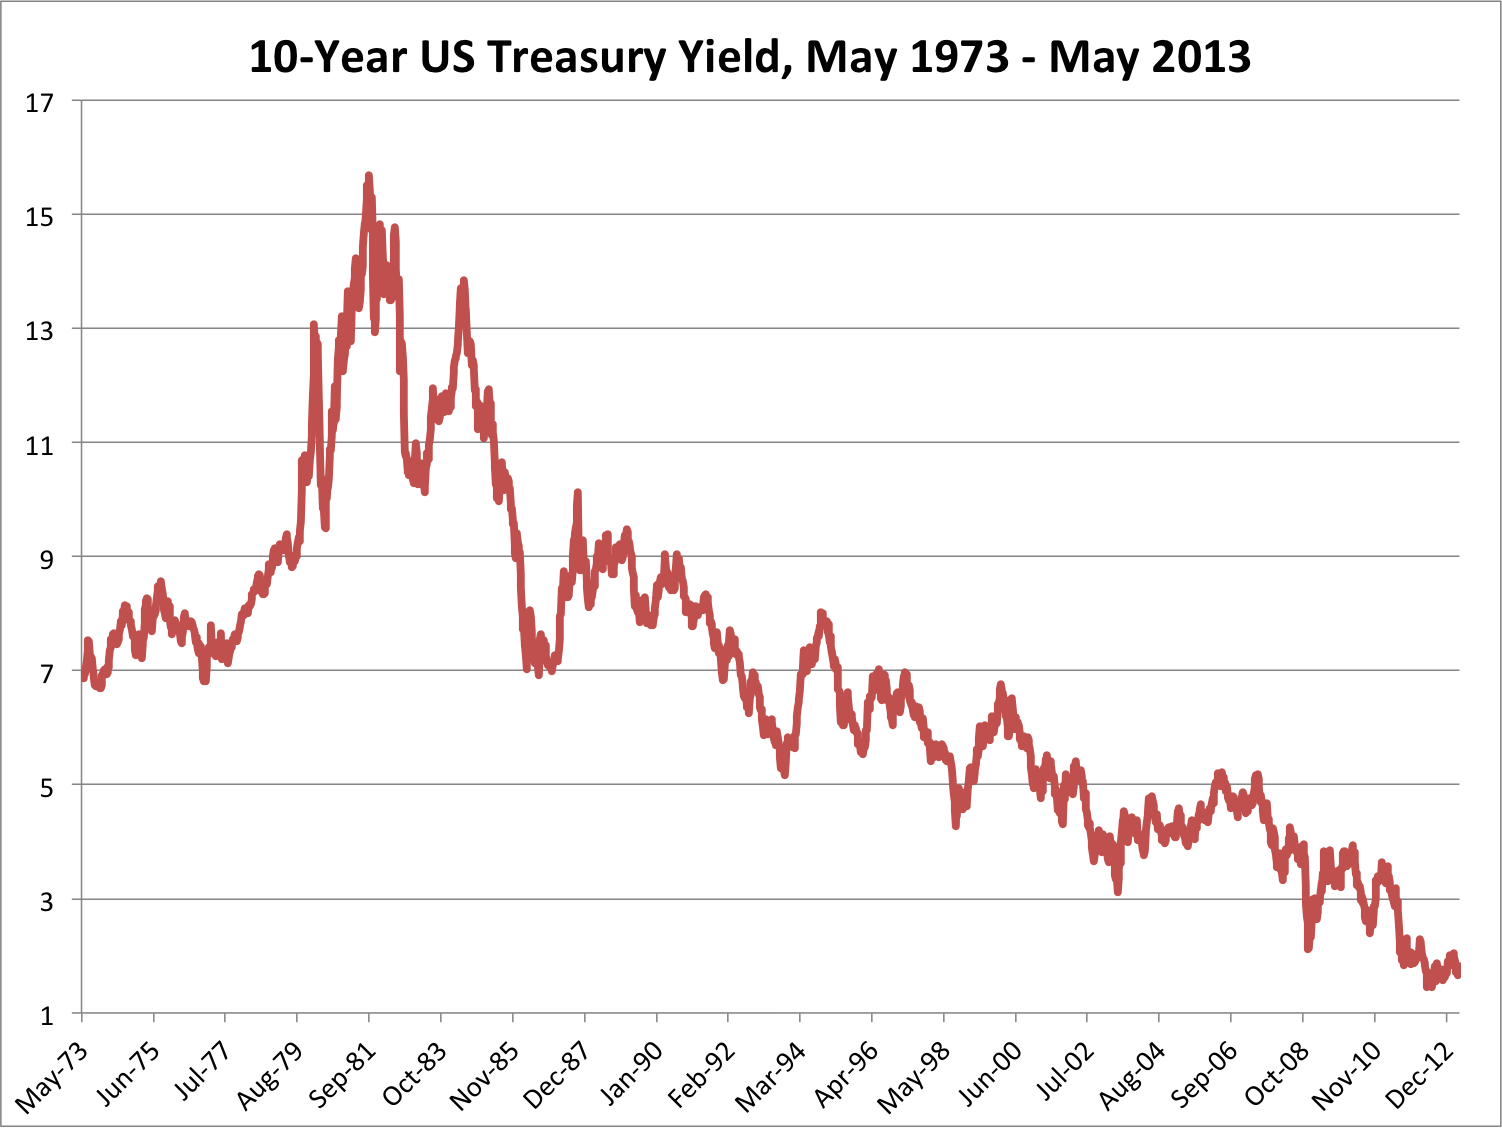
Whether or not the central bank policies will improve global economic growth, it’s clear that the actions have pushed stock markets higher. Loose monetary policy has rendered cash worthless and made bonds vulnerable in the longer term. As Fed officials speak this week, investors will be interested in how they plan to unwind their “cash is trash” policy. When they do, the 30-year bond bull market may finally come to an end and this chart will finally have an upward slope.

10 yr treas 1973-2013

Markets: The Dow and the S&P 500 finished at record levels, while the NASDAQ settled at its highest level since November 2000. The strength of the rally has been persistent: the Dow has not had a losing streak of 3 consecutive days this year — longest such streak since 1958.

  • DJIA: 15,118, up 1% on week, up 15.4% on year
  • S&P 500: 1633, up 1.2% on week, up 14.6% on year
  • NASDAQ: 3436, up 1.7% on week, up 13.8% on year
  • June Crude Oil: $96.04, up 4.5% on week
  • June Gold: $1436.6, down 1.9% on week
  • AAA Nat'l average price for gallon of regular Gas: $3.58

THE WEEK AHEAD: Retail sales are likely to drop, due to a decline in gas prices and auto sales. Meanwhile, retailers will check in with corporate earnings. With 90 percent of S&P 500 earnings in the can, profits are up 5 percent from a year ago, but revenues are only ahead by 1.3 percent.

Mon 5/13:

8:30 Retail Sales

10:00 Business Inventories

Tues 5/14:

8:30 Import/Export Prices

Weds 5/15:

Macy’s

8:30 Producer Price Index

9:15 Industrial Production

10:00 Housing Market Index

Thurs 5/16:

JC Penney, Kohl’s, Nordstrom, Wal-Mart

8:30 Weekly Claims

8:30 Consumer Price Index

8:30 Housing Starts

10:00 Philadelphia Fed Survey

Fri 5/17:

9:55 Consumer Sentiment

10:00 Leading Indicators

Week ahead: April jobs, stock market records

stockmkt.jpg

Here’s a sure sign that expectations have shifted after the Great Recession: the collective sigh of relief from economists and investors after the Labor Department said the US economy created a better than expected 165,000 jobs in April and the unemployment rate edged down to 7.5 percent, the lowest level since December 2008. These results are nothing too special. After all, 165,000 matches the average monthly job growth that has occurred over the past three years and 7.5 percent unemployment is still incredibly high. But nearly four years after the end of a once-in-a-generation recession and financial melt down, those numbers were just what was needed to soothe “spring economic slow-down” anxieties.

The internals of the report also helped to buoy sentiment: the positive revisions to both the March and February numbers added an additional 114,000 jobs than were previously reported; and there was also progress for those who have been out of work for more than 6 months. The number of long-term unemployed fell by 258,000 to 4.4 million, down from the peak of 6.7 million. Sure, that number is high, but over the past 12 months, there has been a near 700,000-drop in the total. The long term unemployed is at 2.8 percent of the labor force, which is the lowest since May 2009.

So where do we stand in all of this? When an economy only grows by about 2 percent annually, it can only produce so many new jobs, which is why nonfarm payroll jobs are still 1.9 percent below where they were when the downturn began in December 2007. At the current pace of job creation, the economy should return to pre-recession in about 18 months, at which time the unemployment rate will probably drop to 6.5 percent. That’s progress, but it sure doesn’t seem like cause for a big celebration…

Markets: While the April jobs report is subject to revision, fears that a spring slowdown would stymie job growth have yet to turn into reality, which helped the bulls take control and push the Dow above 15,000 and the S&P 500 over 1600 for the first time ever.

Not to suck the life out of the party, but it took the Dow nearly six years (1,457 trading days) to cross 15,000 after it first topped 14,000 in July 2007. This is an especially long time when compared to the shortest time frame for a 1000-point move (23 days to rise from 10,000 to 11,000), which took place in 1999. Calendar watchers take note: Dow 15,000 occurred on the 14th anniversary of the first time it crossed 11,000 (May 3, 1999), which of course is as irrelevant as the number itself.

Source: WSJ

The S&P 500’s milestone took even longer: the broad index first crossed above 1500 in March 2000, which means that it’s taken 13 years, one month and 11 days for the index to jump a mere 100 points, the fourth biggest time span separating 100-points. The shortest time occurred in 1999, when it took the index 84 days to go from 1300 to 1400.

  • DJIA: 14,973, up 1.8% on week, up 14.3% on year
  • S&P 500: 1614, up 2% on week, up 13.2% on year
  • NASDAQ: 3378, up 3% on week, up 11.9% on year
  • June Crude Oil: $95.61, up 2.8% on week
  • June Gold: $1464.20, up 0.7% on week
  • AAA Nat'l average price for gallon of regular Gas: $3.52

THE WEEK AHEAD: Investors will have plenty of time to chew on the jobs data and the market highs, as the economic calendar will be light and earnings season will be winding down.

Mon 5/6:

Tues 5/7:

Walt Disney, Whole Foods

10:00 Job Openings and Labor Turnover survey (JOLTS)

3:00 Consumer Credit

Weds 5/8:

Thurs 5/9:

Chain store sales

8:30 Weekly Claims

10:00 Wholesale inventories

Fri 5/10:

G-7 Finance ministers and central bank governors meet in London

Ben Bernanke speech at Chicago Fed banking conference

2:00 Treasury Budget