![Jill on Money [ Archive]](http://images.squarespace-cdn.com/content/v1/59efbd48d7bdce7ee2a7d0c4/1510342916024-TI455WZNZ88VUH2XYCA6/JOM+Blue+and+White.png?format=1500w)
I joined CBS This Morning to discuss how consumer prices of gas and groceries increased last month and if there's any signs inflation is slowing down.
The Price is Wrong

If you feel like things are more expensive, you are right. Despite a slightly weaker than expected inflation report in April, this year, prices have accelerated faster than Fed officials anticipated just a few months ago. Last week we learned that headline inflation increased to a 14-month high of 2.5 percent from a year ago in April, due in large part to rising gas prices. Excluding food and energy the core rate increased by 2.1 percent.
2015 Economic Crystal Ball

No rest for the weary or hung over…time to dust off the crystal ball to see what lies ahead! Global Economy: After increasing at an estimated 2.4 percent rate in 2014, economists expect that U.S. GDP will pick up to 3 percent this year, which would be the strongest growth in a decade. Since 2000, the fastest real GDP growth was 3.8 percent in 2004, and the fastest growth for the recovery was 2.5 percent in 2010. The dot-com meltdown, plus the financial crisis has taken a toll on the U.S. economy since 2000, with an annualized pace of 1.9 percent, well below the post World War II average of 3.3 percent.
The drivers of growth include: consumers, who after paying down lots of debt, should see wage gains and will continue to enjoy the benefits of low energy prices; state and local governments, which have stopped slashing budgets and may spend a bit more freely; and the housing market, which after taking a breather in 2014, should contribute more to the economy in 2015.
Outside the U.S., the picture is more complicated. China’s double-digit growth rates are a thing of the past, as the world’s second largest economy attempts to impose controls that will likely keep GDP at six to 7 percent in the year ahead. Japan and Europe are still battling low prices, which is why central banks in both areas are likely to crank up efforts to defend against inflation. Emerging markets will continue to diverge, with countries that have not addressed economic imbalances, like Russian, Brazil and Venezuela struggling, while more balanced economies, like India, Thailand and Chile should be better positioned for growth.
2015 Year of the Raise: If 2014 was the year of the job (probably the best year for job creation since 1999), economists are hopeful that 2015 will be the year of the raise. Wage growth has remained stubbornly at 2 percent during the recovery, but this year, the improving economy and labor market should help wage growth finally start to outpace the rate of inflation.
Federal Reserve Rate Hikes: With bond buying over, the big question for 2015 is: “When will the Fed FINALLY increase short-term interest rates?” Reading between the lines of central bank speeches, statements and press conferences, most believe the first rate hike will occur in the third quarter of the year. Goldman Sachs analysts’ noted that once the Fed starts the process, it could move faster than the market now expects.
Oil: At her last press conference of the year, Janet Yellen called low oil a “transitory” phenomenon, which loosely translated means “Don’t get too used to those cheap gas prices!” The reason is that supply and demand will surely change. If the global economy picks up, so too will demand for oil, but these changes often occur slowly, which is why some economists are predicting that oil prices will likely remain in a range of $50 to $75 a barrel in 2015.
2014 MARKETS:
- DJIA: 17,823.07, up 7.5% (6th annual gain, longest streak since 1990s)
- S&P 500: 2058.90, up 11.4% (up an average of 20.7% a year for the last 3 years including dividends, its best three-year returns since the late 1990s)
- NASDAQ: 4736.05, up 13.4%
- Russell 2000: 1204.70, up 3.53%
- Stoxx Europe 600: 342.54, up 4.35%
- Argentina Merval: 8579.02, up 59.14%
- Shangahi A Shares (Mainland China): 3389.40, up 53.06%
- RTS Russia: 790.71, down 45.19%
- 10-Year Treasury yield: 2.173% (from 3.03% a year ago)
- February Crude Oil: $53.27, down 46% (lowest level since May, 2008)
- February Gold: $1,184.10, down 1.5%
- WSJ Dollar index: 83.04, up 12% (highest level since Sep 2003)
- AAA Nat'l average price for gallon of regular Gas: $2.24 (from $3.32 a year ago)
THE WEEK AHEAD:
Mon 1/5:
Automobile Sales
Tues 1/6:
9:45 PMI Services Index
10:00 Factory Orders
10:00 ISM Non-Mfg Index
Weds 1/7:
8:15 ADP Employment Report
8:30 International Trade
2:00 FOMC Minutes
Thurs 1/8:
8:30 Weekly Jobless Claims
3:00 Consumer Credit
Fri 1/9:
8:30 December Jobs Report
10:00 Wholesale Trade
Oil Plunge and Janet’s “Considerable” Dilemma

Considerable adjective: large in size, amount, or quantity “Considerable” is the word of the week, as all eyes move from plunging oil markets to the Federal Reserve. This week, central bank officials gather for their last policy confab of the year. With bond buying now done and the economy expanding, the big question is: how might the Fed alter its policy statement to prepare investors for the inevitable increase in short-term interest rates?
Previously, the Fed has said that it would leave rates at near zero for a “considerable time,” but with the labor market improving and the economy gaining strength, there’s a case to be made to shift that language to a word of phrase that might equate to a shorter period of time. Analysts at Capital Economics have turned back the clock by a decade to see what terminology officials’ used ahead of the tightening cycle that began in 2004. “Back then the Fed went from saying that low rates would be maintained for a ‘considerable period’; to the FOMC would be ‘patient’ in removing accommodation; and then to accommodation will be removed at a ‘measured’ pace.”
Here’s how the Fed’s words translated into time:
- Considerable: 6 - 10 months
- Patient: 2 - 5 months
- Measured: one month
OK, so remember back in March when Fed Chair Janet Yellen had that woops moment at her first presser? That’s when she let it slip out that the Fed would raise rates “something on the order of around six months” after QE ended. Since QE concluded at the end of October, something on the order of six months would bring us to April 2015. Conveniently, there is a policy meeting on April 28-29, 2015 so that might be a fine time to start the process.
HOLD YOUR HORSES! The recent acceleration of the oil market sell-off may put a wrinkle on the “considerable” to “patient” exchange. While the 46 percent drop in crude oil from the June highs amounts to about $100 per month savings for US consumers, there are some analysts who believe that crashing oil is the canary in the coal mine for the global economy.

Until the last week or so, most have thought that the oil story was one part increased supply and one part tepid demand, but what if the balance is tipping in the wrong direction? In that case, falling oil has more to do with a big slow down in Chinese, European and Japanese economies than with the growth of U.S. production. In fact, that weakening growth prompted OPEC to predict that demand for its oil will hit a 12-year low next year.
If the world is really slowing down, then can the U.S. remain an outlier of growth for much longer? Investors answered that question with a “NO WAY” last week and sold stocks to underscore the point. After all, if you’re sitting atop healthy gains for the year (the S&P 500 is still up 8.3 percent YTD) and you think the globe is slowing, a reasonable response is to lighten up on your equity positions and see how things unfold. The Federal Reserve may also opt to maintain the status quo on its wording, at least until the first meeting of 2015.
MARKETS: The Grinch stole the Santa Claus rally, at least for a week! Despite seeing the worst week of 2014, the S&P 500 remains within 4 percent of its all-time high.
- DJIA: 17,280, down 3.8% on week, up 4.2% YTD (worst week since Sep 2011)
- S&P 500: 2075, down 3.5% on week, up 8.3% YTD (worst week since May 2012)
- NASDAQ: 4653, down 2.7% on week, up 11.4% YTD
- Russell 2000: 1152, down 2.5% on week, down 1% YTD
- 10-Year Treasury yield: 2.08% (from 2.31% a week ago)
- January Crude Oil: $57.81, down 12% on week (lowest close since May 2009; down 46% from June peak)
- February Gold: $1,190.40, up 2.7% on week
- AAA Nat'l average price for gallon of regular Gas: $2.56 (from $3.24 a year ago)
THE WEEK AHEAD:
Mon 12/15:
8:30 Empire State Manufacturing
9:15 Industrial Production
10:00 Housing Market Index
Tues 12/16:
8:30 Housing Starts
FOMC Policy Meeting begins
Weds 12/17:
8:30 Consumer Price Index
2:00 FOMC Policy Decision/Statement
2:30 Janet Yellen Press Conference
Thurs 12/18:
8:30 Weekly Jobless Claims
10:00 Philadelphia Fed Survey
10:00 Leading Indicators
Fri 12/19:
10:00 State Unemployment
10:00 Kansas City Fed Manufacturing
Will OPEC Decision Halt the Santa Claus Rally?

While you were enjoying your Thanksgiving meal, the 12 members of the Organization of the Petroleum Exporting Countries (OPEC) announced that the cartel would hold its output target at 30 million barrels per day. The decision caused a steep sell off in Brent crude oil (the global benchmark) on the ICE Futures Europe. When U.S. markets opened on Friday, investors dumped West Texas Intermediate crude on the New York Mercantile Exchange and futures plunged 10.2 percent to $66.15 a barrel, the lowest settlement since September 2009. Both oil benchmarks are experiencing their worst losing streaks since the financial crisis in 2008, with 18 percent losses for the month of November. As previously mentioned in this space (Peak Oil Pukes), sinking oil and gas prices should help consumers, but the savings has not yet created overall cheer. Last week, the Conference Board said that its consumer confidence index dropped to a four month low in November. But Capital Economics notes “this fall needs to be taken into context alongside the sharp rise earlier in the year.” In fact, confidence is still close to seven-year highs.
What has been driving confidence this year has been the steady improvement in the jobs situation. Through October, the economy has added 2.225 million private sector jobs and 2.285 million total jobs in 2014. The November jobs report, which is due this Friday, is expected to show that the economy added 220,000 jobs. If that happens, 2014 will be the best year for private employment since 1999, according to Calculated Risk.
The unemployment rate is expected to remain at 5.8 percent, which puts it close to the Federal Reserve’s estimate of the longer-term, normal rate of unemployment of 5.2 percent to 5.5 percent. But with wages still up only 2 percent year over year, the central bank is likely to keep interest rates at 0 to 0.25 percent until next year.
Despite lots of energy and attention, the initial reports from retailers about the big holiday weekend may tell us less about the economy than the jobs report. Analysis from the New York Times found that while the holiday season is important for retailers, it “matters only a little bit” for the overall economy. The reason is clear: consumers would spend a certain amount of money in any two months. When stripping out the normal expenditures, “for the last two months of the year, Americans are on track to spend $106 billion more than they would if these were any old months.” Not that you would sneeze at $106 billion, but compared to the $17.6 trillion US economy, it’s not nearly as important as the elusive 3 percent increase in wages that we have seen in previous expansions.
MARKETS: Will investors be treated to a “Santa Claus Rally”? The old Wall Street chestnut predicts stocks do well during the period just after Thanksgiving through the end of the year. Over the past five years, the S&P 500 has gained an average of 2.5 percent during December. But OPEC's decision to maintain current production levels could weigh on energy stock prices, curtail energy company profits and limit the near-term upside in markets.
- DJIA: 17,828, up 0.1% on week, up 2.5% on month, up 7.6% YTD
- S&P 500: 2067, up 0.2% on week, up 2.5% on month, up 11.9% YTD
- NASDAQ: 4791, up 1.7% on week, up 3.5% on month, up 14.7% YTD
- Russell 2000: 1173, up 0.01% on week, up 2% on month, up 0.8% YTD
- 10-Year Treasury yield: 2.17% (from 2.31% a week ago)
- January Crude Oil: $66.15, down 13.5% on the week, down 18% on month
- December Gold: $1175.50, down 1.8% on the week
- AAA Nat'l average price for gallon of regular Gas: $2.78 (from $3.28 a year ago)
THE WEEK AHEAD:
Mon 12/1:
Cyber Monday
9:45 PMI Manufacturing
10:00 ISM Manufacturing
Tues 12/2:
Motor Vehicle Sales (2014 is on pace to be the best year since 2006)
10:00 Construction Spending
Weds 12/3:
8:15 ADP Private Sector Employment Report
8:30 Productivity
10:00 ISM Non Manufacturing
2:00 Fed Beige Book
Thurs 12/4:
8:30 Weekly Jobless Claims
Fri 12/5:
8:30 November Employment Report
10:00 Factory Orders
3:00 Consumer Credit
Peak Oil Pukes

Remember when energy analysts were scaring everyone with the concept of “Peak Oil”? The theory was that global oil production had peaked and as a result, prices would shoot up to $200 a barrel and the cost at the pump would top $10 per gallon. Flash forward to this past week, when West Texas Intermediate (WTI) and North Sea Brent Crude touched new four-year lows. (The Energy Information Agency provides a good description of the two benchmarks here.) The combination of the U.S. shale boom and weakening Chinese and European demand has pushed down oil prices 30 percent since June. And according to the International Energy Association, lower prices are likely to continue into the first half of next year. Short of a geopolitical flare up, the IEA believe the we are entering “a new chapter in the history of the oil markets.”
The Energy Information Agency said that US oil production reached 8.9 million barrels per day in October, the highest monthly production since July 1986. The agency is forecasting that production will average 9.4 million barrels per day next year, which would be the most since 1972. As a result, the government cut its forecast for global oil prices next year by $18 a barrel to $83. The EIA notes that a $1-per-barrel change in the price of crude oil translates into a change of about 2.4 cents per gallon of gasoline (There are 42 gallons in one barrel, and 2.4 cents is about 1/42 of $1) and so the agency also predicts that the average price of gas will be below $2.94 a gallon next year, a 44-cent drop from an outlook issued a month ago.
If that holds, consumers will save $61 billion on gas compared with this year. That may not seem like a lot in the context of a $17.5 trillion U.S. economy, but economists say it matters because it immediately gives consumers more money to spend on other things…like holiday shopping!
Before we get too ahead of ourselves with visions of sugar plum fairies and the like, you may wonder if there is a downside to the drop in oil. A recent Sanford C. Bernstein report noted that oil at $80 a barrel makes one-third of U.S. shale oil production uneconomical. If that’s the case, there is a fear that state economies like Texas and North Dakota which combined, account for about half of the nation’s oil production, could take a hit to their energy-dependent economies.
But any pullback on the local level is likely to be outweighed by a more general increase in economic growth. Estimates range from a 0.3 to 0.5 percent bump in fourth quarter GDP from lower oil and gas prices. That might not seem like a lot, but it sure would come in handy for the holidays and kick US growth into a higher gear.
There was one other piece of good news for US consumers: College costs are still rising, but at a slower pace. According to a report from the College Board, tuition and fees for four-year public colleges averages $9,139 for in-state students, an increase of less than 1 percent after inflation (Room and board adds $9,804 to the total bill). In 2009-2010, the annual increase at public institutions was 9.5 percent. Tuition and fees for four-year private nonprofit colleges were $31,231 ($42,419 with room and board), up 1.6 percent after inflation, down from the recent peak in price growth of 5.9 percent in 2009-2010.
The College Board issued a separate report, which found that students and parents borrowed $106 billion in the 2013-2014 academic year from the federal government and other sources, down nearly 8 percent from the previous year after accounting for inflation, and down 13 percent from 2010-2011 peak of $122.1 billion.
MARKETS: With stock indexes at record highs, investors are feeling good. The latest survey from the American Association of Individual Investors found that bullishness spiked to a four-year high of nearly 58 percent. Bearish sentiment, or expectations that markets will fall over the next six months was at 19.3 percent, below the historical average of 30 percent. If you believe that investors are often happiest at the wrong times, this could be seen as a warning…
- DJIA: 17,634, up 0.4% on week, up 6.4% YTD
- S&P 500: 2039, up 0.4% on week, up 10.4% YTD
- NASDAQ: 4688, up 1.2% on week, up 12.3% YTD
- Russell 2000: 1174, up 0.05% on week, up 0.9% YTD
- 10-Year Treasury yield: 2.32% (from 2.30% a week ago)
- December Crude Oil: $75.82, down 3.6% on the week (7th consecutive weekly loss)
- December Gold: $1185.60, up 1.3% on the week
- AAA Nat'l average price for gallon of regular Gas: $2.88 (from $3.21 a year ago; longest decline in gas prices since 2008)
THE WEEK AHEAD: Freddie Mac said fixed mortgage rates are hovering near 2014 lows, with 30-year fixed-rates averaging 4.01 percent, down from 4.35 percent a year ago. Will those low rates spur housing activity? We’ll learn more this week, when reports on Housing Starts and Existing Home Sales are released.
Mon 11/17:
Urban Outfitters, Tyson, Agilent
8:30 Empire State Manufacturing Survey
10:00 Industrial Production
Tues 11/18:
Home Depot, TJX
U.S. Senate may vote to approve the Keystone XL pipeline
8:30 Producer Price Index
10:00 NAHB Housing Market Index
Weds 11/19:
Target, Staples, Lowes, Williams-Sonoma
8:30 Housing Starts
2:00 Fed Minutes
Thurs 11/20:
Best Buy, Dollar Tree, Gap
8:30 Weekly Jobless Claims
8:30 Consumer Price Index
10:00 Philadelphia Fed Survey
10:00 Existing Home Sales
Fri 11/21:
Ann Taylor, Foot Locker
Near-Correction to Stock Market Highs: We Still Stink at Investing

The WSJ’s Morgan Housel gets the market-timing award of the season. On September 13th, he wrote “With stocks more than doubling in value over the past five years, now is the time to prepare yourself for the emotional roller coaster that will come during the inevitable correction.” (Emphasis mine.) While an official correction of 10 percent did not materialize, on September 19th, just days after Housel's article was published, the S&P 500 hit an all-time high of 2,019 and then began a 9.8 percent plunge to an intra-day low of 1,820 on October 15th. U.S. stock indexes reclaimed new highs on Friday (see the numbers below), rescuing what was shaping up to be an ugly month. Market action in October was a great lesson in a few tried and true investment mantras, like “stick to your game plan”, “being an investor means signing up for ups and downs from time to time” and “don’t let your emotions take over”.
And about those emotions…they really can mess with your investment returns, because so often, they lead you to buy high and sell low, which can cost the average investor about three percentage points a year in lost return over the long run. The proclivity to trade at exactly the wrong time encouraged Business Insider to add “YOU SUCK” to this chart from Richard Bernstein Advisors: (click on the chart to enlarge):
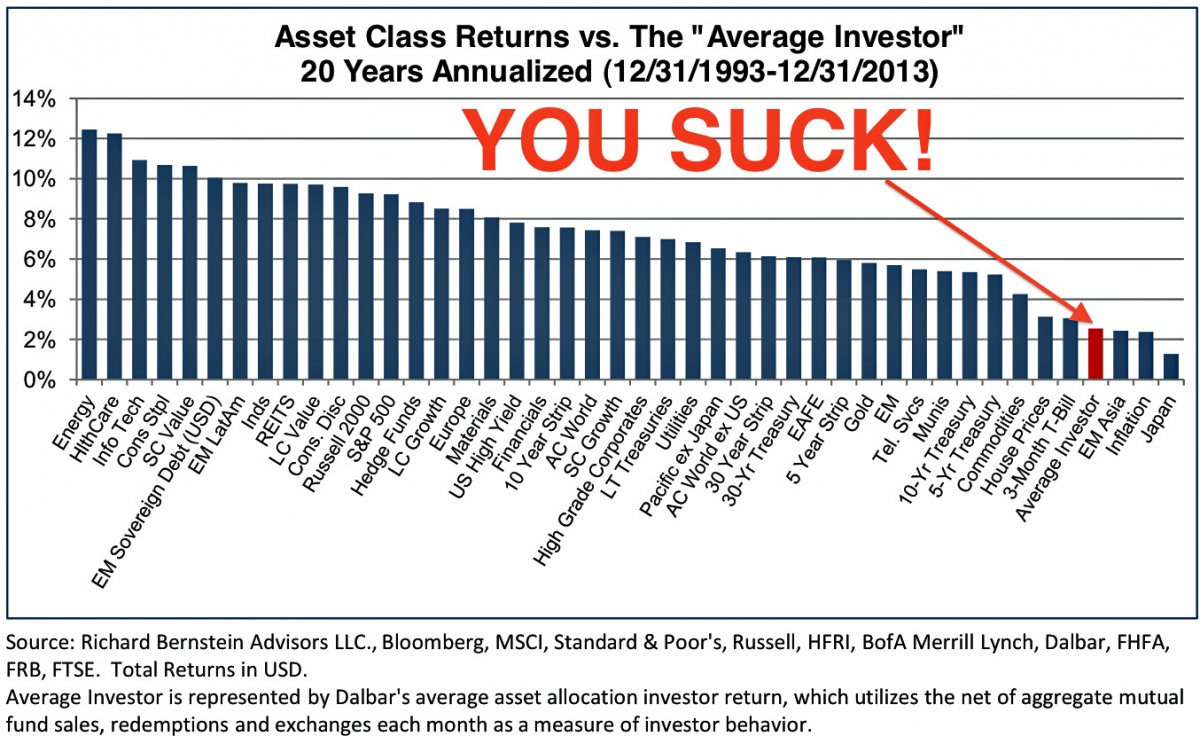
You’ll notice that during this twenty-year period, which includes the dot-com boom and bust, as well as the recent housing and credit boom and bust and the Great Recession, the Average Investor has not done too well. The reason is clear: people jump in and out of markets at the wrong time! The best defense against those emotional decisions is to stick to that diversified portfolio and don’t mess with it when markets move up or down.
Now that we got that out of the way, let’s return to a fundamental question: How is the economy doing? The first reading of third quarter US growth came in at a better than expected 3.5 percent annual pace, boosted by a 7.8 percent surge in exports and a 10 percent jump in federal spending. That’s the good news. The not-so-good news is that consumer spending, which accounts for about two-thirds of the economy, slowed to a 1.8 percent annual pace from 2.5 percent in the second quarter. As we enter the all-important holiday season, economists are eager to see whether consumers become a tad less parsimonious and open those physical and electronic wallets to spend more freely.
One reason consumers may not have been as willing to spend is that wage growth has only increased at about the pace of inflation. There will be more information about that when the October jobs report is released on Friday. Economists predict that employers added 225,000 jobs and the unemployment rate remained at 5.9 percent, the lowest level since July 2008. If the numbers improve dramatically, it could actually have a negative impact on stocks, as investors may surmise that the Federal Reserve might consider raising short-term interest rates sooner than expected…higher interest rates are seen as a headwind for the stock market.
Reports on manufacturing, as well as factory orders and vehicle sales could tell us whether the combination of a global slowdown and a stronger US dollar is starting to negatively impact US exporters. Last year, manufacturers contributed just over $2 trillion to the economy, which represents 12.5 percent of GDP. But economists focus on the sector because for every $1.00 spent in manufacturing, another $1.32 is added to the economy, the highest multiplier effect of any economic sector.
MARKETS: Just in time for the holiday season and for the first time in four years, prices at the pump for regular gas have dropped to under $3/gallon nationally. Consumers are saving about $250 million a day on gasoline compared with early summer, when the national average hit $3.68 a gallon, according to AAA.
- DJIA: 17,390 up 3.5% on week, up 2% on month, up 4.9% YTD (best percentage weekly gain since Jan 2013)
- S&P 500: 2018, up 2.7% on week, up 2.3% on month, up 9.2% YTD (best two-week gain since Dec 2011)
- NASDAQ: 4630, up 3.3% on week, up 3% on month, up 10.9% YTD (highest level since Mar 2000)
- Russell 2000: 1173, up 4.9% on week, up 6.5% on month, up 0.8% YTD
- 10-Year Treasury yield: 2.34% (from 2.27% a week ago)
- December Crude Oil: $80.54, down 0.6% on the week, down 12% on month (down 25% from June highs)
- December Gold: $1171.60, down 4.9% on the week, down 3.3% on month, down 2.6% YTD (lowest level since Jul 2010)
- AAA Nat'l average price for gallon of regular Gas: $2.99 (from $3.30 a year ago, down 33 cents in October, lowest level since Dec 2010)
THE WEEK AHEAD:
Mon 11/3:
Automobile Sales
9:45 PMI Manufacturing
10:00 ISM Manufacturing
10:00 Construction Spending
Tues 11/4:
8:30 International Trade
10:00 Factory Orders
Weds 11/5:
CBS, NewsCorp, Whole Foods
8:15 ADP Private Payroll Report
10:00 ISM Non-Manufacturing
Thurs 11/6:
AOL, Walt Disney, Zynga
8:30 Weekly Jobless Claims
8:30 Productivity
Fri 11/7
8:30 October Jobs
3:00 Consumer Credit